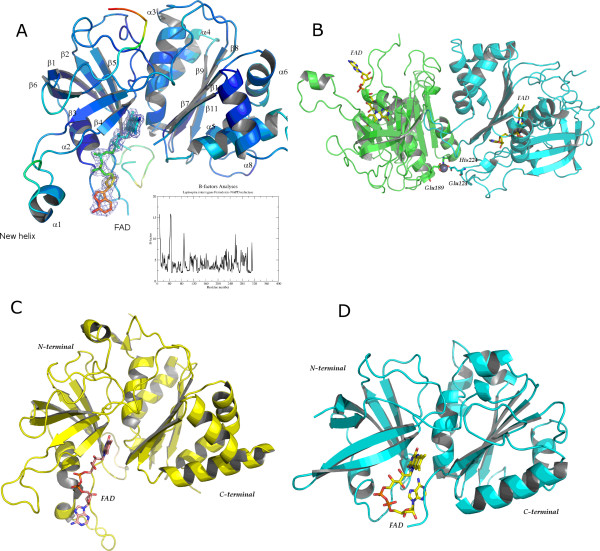
Figure 2.
FNRs Crystallographic models. (a) Crystal structure of LepFNR colored by crystallographic B-factors indicates the region of flexible loops. 2Fobs-Fcalc electron density map contoured at 1.0 sigma is shown for FAD molecule. In the insert, the plot of average B-factor per residue in LepFNR. (b) Detailed view of the metal binding site between two chains of LepFNR. The metal was modeled as a zinc atom. (c) Crystal structure of Zea mays FNR (PDB entry 1JB9[23]), showing FAD molecule in the extended form. (d) Crystal structure of Azobacter vinelandii (PDB entry 1A8P[7]), showing FAD molecule in bended form. The figures were prepared using PYMOL[38].

