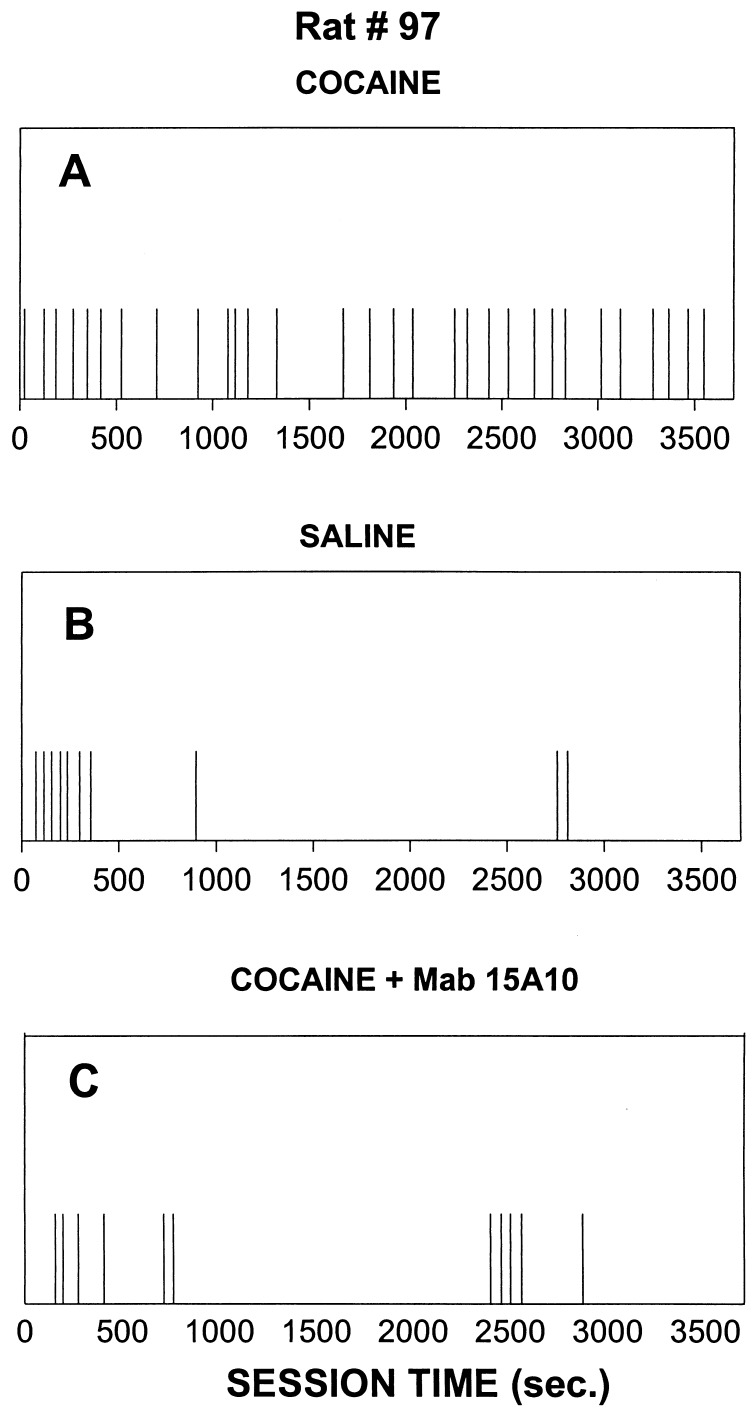
Figure 4.
Pattern of intravenous cocaine (A), saline (B), or cocaine + mAb 15A10 (C) self-administration in a single rat. Each vertical line within the panels indicates a single injection, obtained on a fixed ratio 5 time-out 10 sec schedule of cocaine delivery. The three panels show infusion patterns from three consecutive sessions.

