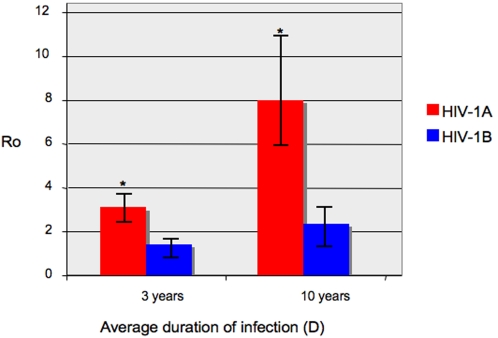
Figure 4. Estimates of HIV-1A and HIV-1B basic reproductive number (R0) in Albania.
R0 estimates for different average duration of infection (D) were inferred from the Bayesian estimates of population growth rate (see materials and Methods). A Black bar indicates the 95% high posterior density intervals of the estimate. An * on top of the bar indicate a statistically significant difference (paired t-test, p<0.01) between R0 estimates for two different subtypes.

