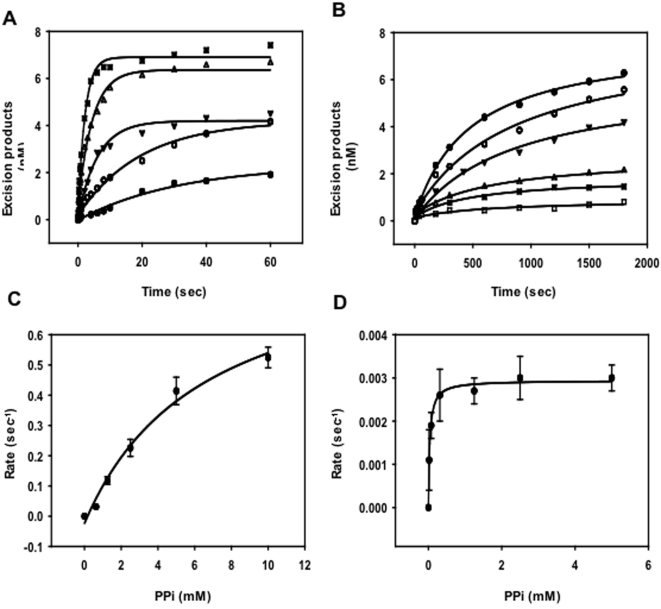
Figure 6. Concentration dependence of the rate of pyrophosphorolysis by WT and D211N Ty1 RT.
A and B show time courses of a single turnover at various sodium pyrophosphate concentrations: 0.6 mM (closed circle), 1.25 mM (open circle), 2.5 mM (closed inverted triangle), 5 mM (open triangle) and 10 mM (closed square) for WT (A) and 0.02 mM (open square), 0.08 mM (closed square), 0.3 mM (open triangle), 1.25 mM (closed inverted triangle), 2.5 mM (open circle) and 5 mM (closed circle) for the D211N enzyme (B) respectively. A 5′ 32P-end labeled substrate 15-mer/28′-mer (RAG*1316/1109, Fig. 1) was used for the experiment. For WT, samples were taken at 0, 0.1, 0.2, 0.4, 0.6, 0.8, 1, 1.5, 2, 3, 4, 6, 8, 10, 20, 30, 60 second time points. For the mutant, samples were taken at 5 or 10 second intervals for the first minute and then every minute for the next 4 minutes. C and D show pre-steady-state rate dependence of nucleotide cleavage on PPi concentration for WT and mutant respectively, based on the rates derived from Equation 1 (see Experimental Procedures) in A and B. Curves represent the best fits to Equation 2 (see Experimental Procedures).

