
Figure 3.
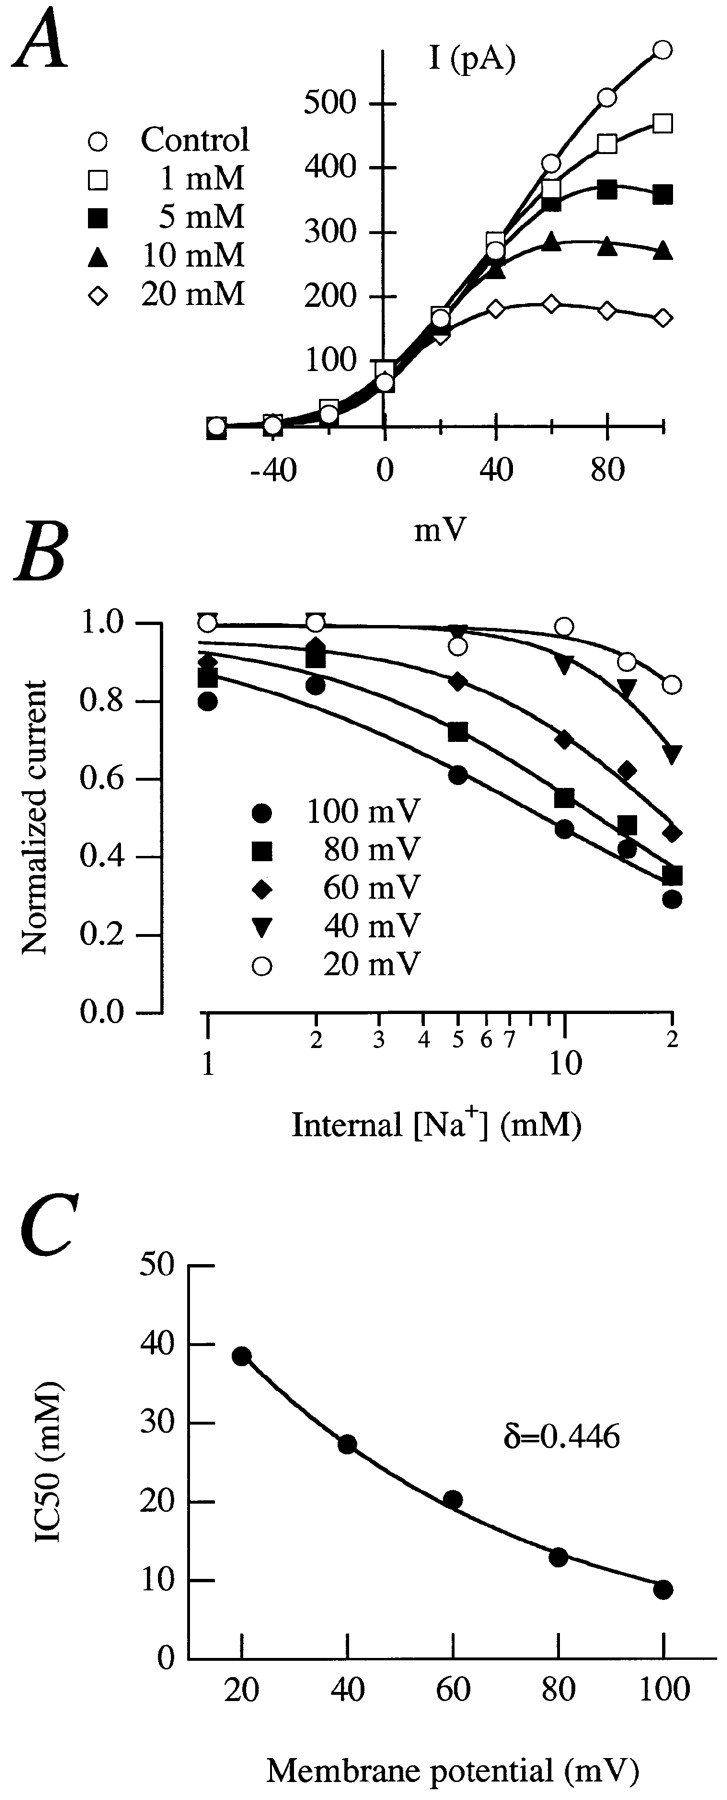
(A) Normalized current–voltage relationships in an inside-out patch from an oocyte expressing rectifying currents in the presence of different internal Na+ concentrations. The stimulation protocol was as the one in Fig. 2. (B) Dose–response plots for effects of Na+. The solid lines are fits to the Hill equation. (C) IC50 plotted versus voltage. The exponential fit to Eq. 1 gave a value for δ of 0.446.