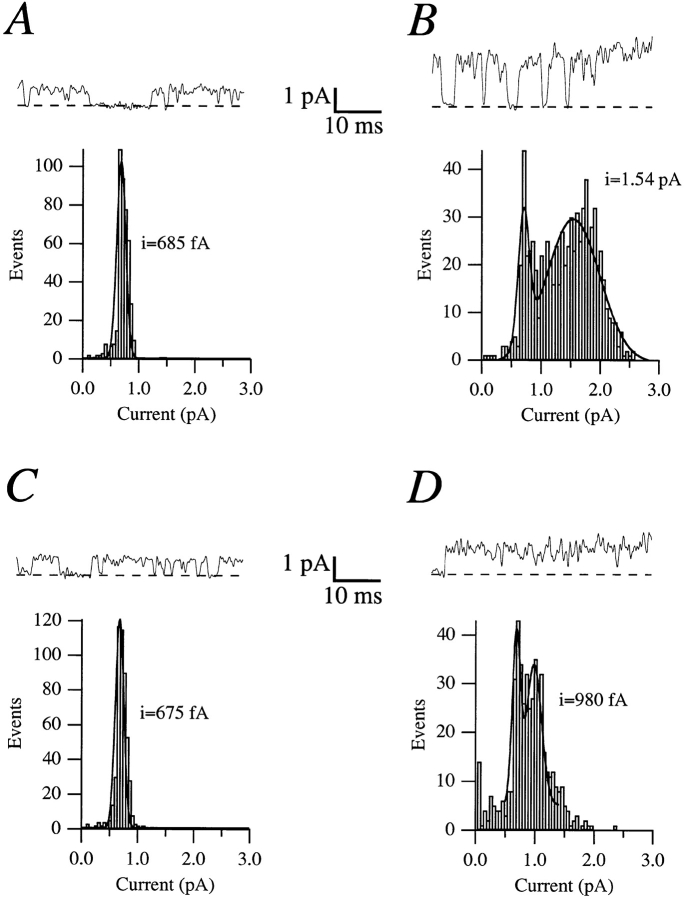
Figure 4.
Sample traces and amplitude histograms obtained from the same patch without (A and B) or with (C and D) 5 mM NaCl added to the intracellular side, at either 0 (A and C) or +80 mV (B and D). The single channel currents are obtained from the fit to a Gaussian distribution. The smaller amplitude in the histograms at +80 mV corresponds to the amplitude of the flickering of the channel, and remains constant in the absence (B) or in the presence (D) of Na+.

