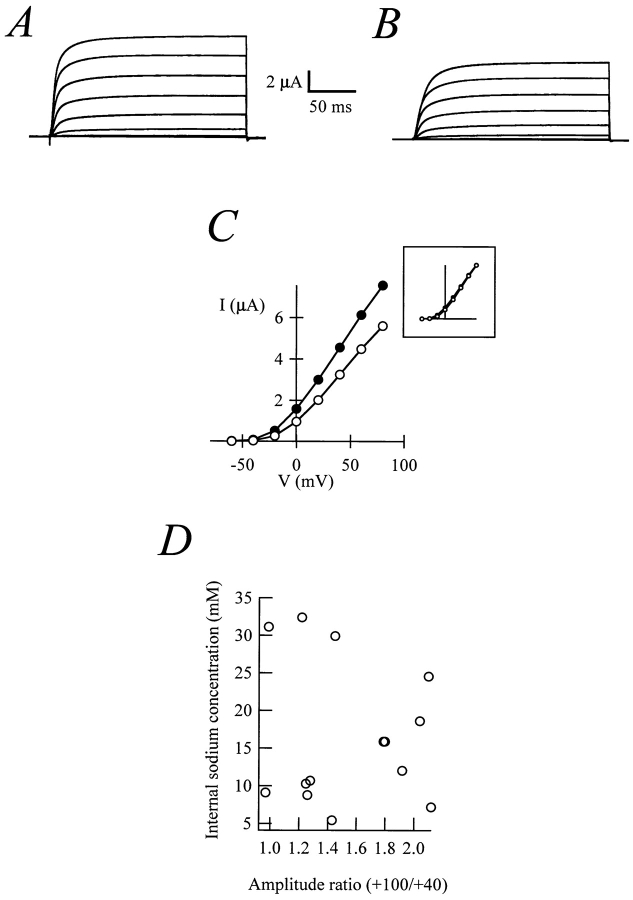
Figure 5.
Currents recorded from a whole oocyte before (A) and after (B) the injection of 50 nl 2 M NaCl. (C) Current–voltage plots for steady-state currents from A and B. (Inset) The normalized currents. (D) Lack of correlation between the internal Na+ concentration (calculated from the reversal potential of Na+ currents) and the degree of rectification of r-eag currents. The correlation coefficient is −0.1.

