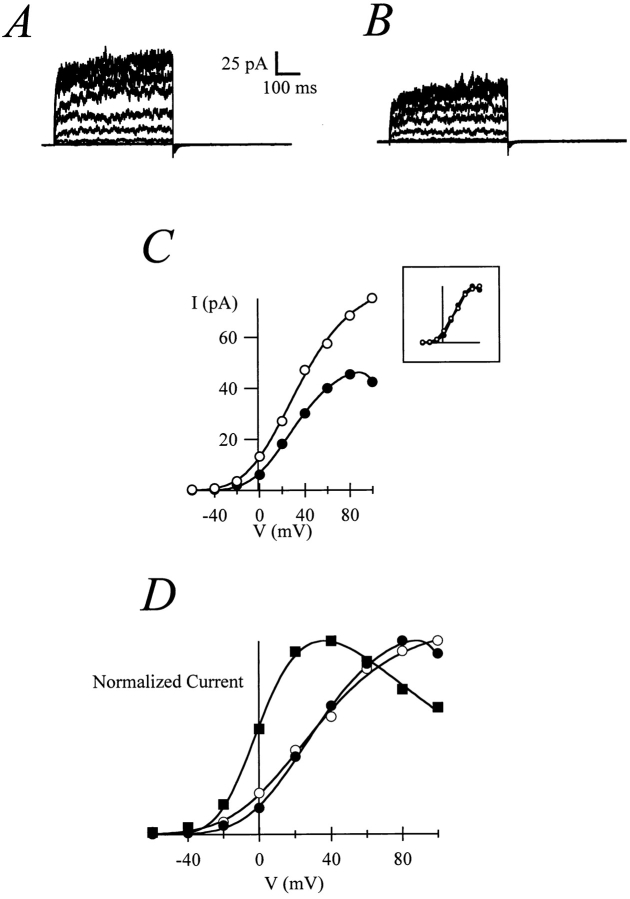
Figure 6.
Before maturation, patches expressing r-eag currents show only slight rectification with 20 mM Na+ (A, control traces; B, 20 mM Na+), as can be seen in the I-V plot (C; open circles, control; solid circles, 20 mM NaCl) and more clearly after normalization of the current amplitude (inset). After MPF injection, patches from the same oocyte show rectification comparable to mature oocytes (D; solid squares); for comparison, the normalized current amplitudes from A and B have been included (symbols as in C).

