
Figure 6.
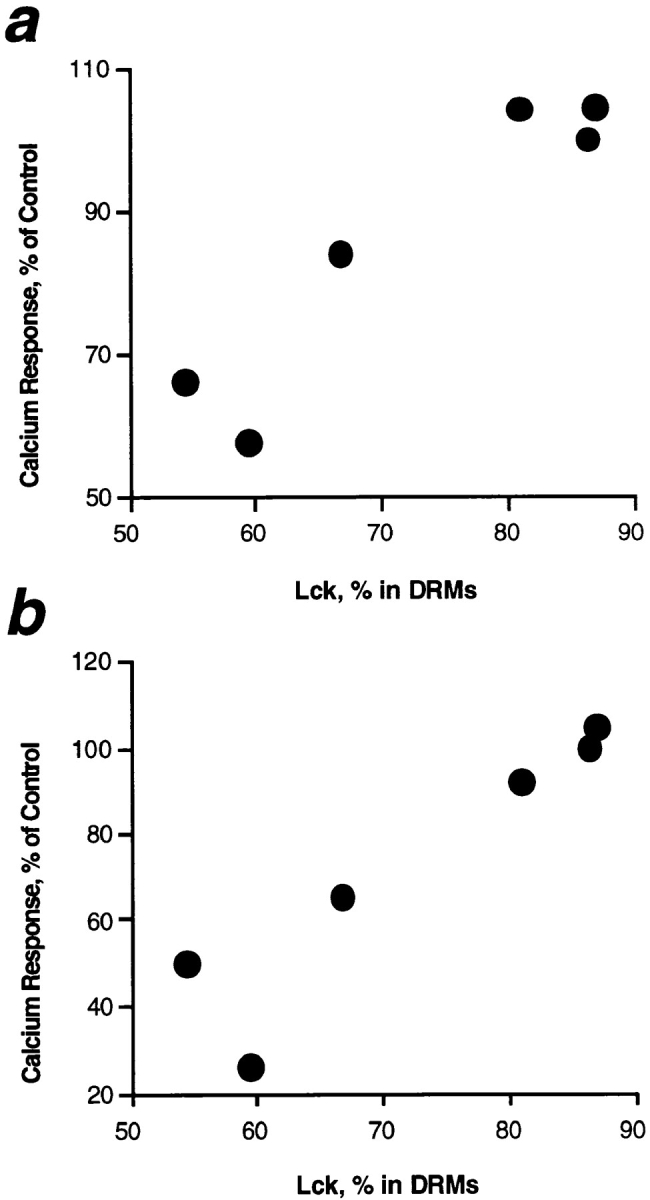
Correlation of T cell calcium response with the presence of Lck in DRMs. T cells were treated with 50 μM of individual fatty acids or ethanol alone as given in Fig. 4. The proportion of Src family kinase Lck recovered in DRM fractions 4–7 as shown in Fig. 4 is given on the abscissa, and means of calcium responses via CD3 (a) or GPI-anchored CD59 (b) are displayed on the ordinate. Note the close correlation between both parameters in all fatty acid treatments.