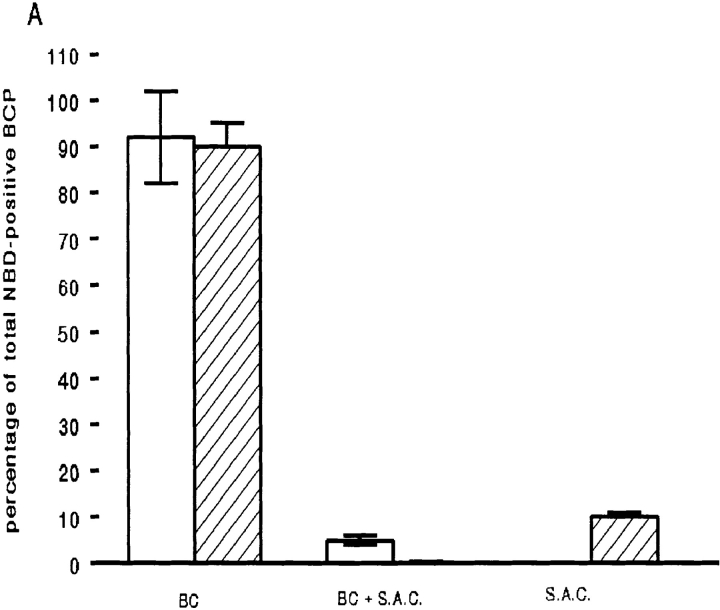
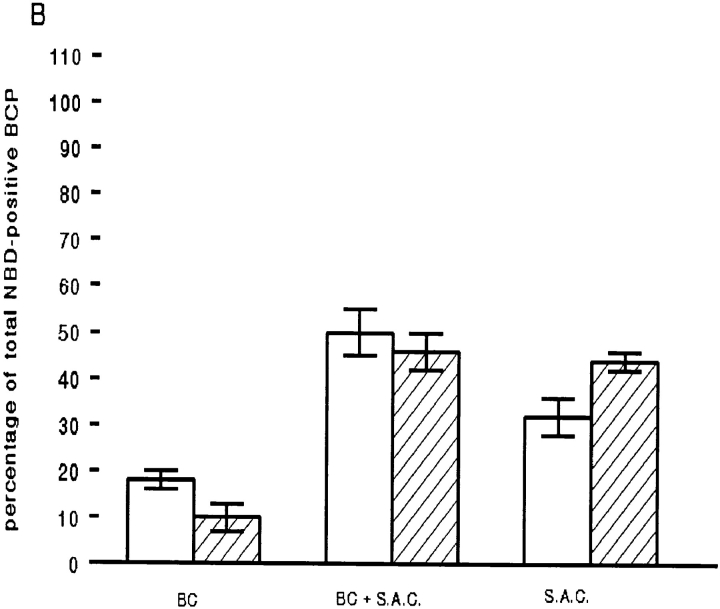
Figure 3.
Semi-quantitative analysis of BCP labeling: accumulation of C6-NBD-lipid analogues in SAC. Cells were labeled and treated as depicted in Fig. 1. A represents the distribution of NBD lipid in BC and SAC after step 1 (30 min at 37°C) while the distribution indicated in B was obtained after a subsequent back exchange and chase from BC at 18°C for 60 min (Fig. 1, step 2 and 3). In both cases, the percentage C6-NBD-GlcCer- and C6-NBD-SM-labeled BCP was ∼85%. Labeling of BCP was distinguished in either NBD-positive BC only, a cellular BCP fraction in which both BC and SAC were labeled (BC + SAC), or NBD-positive SAC. Data are expressed as percentage of the total number of C6-NBD-GlcCer– (white bars) and C6-NBD-SM–positive (hatched bars) BCP (minimum of 50/coverslip; mean ± SEM) of at least four independent experiments carried out in duplicate.


