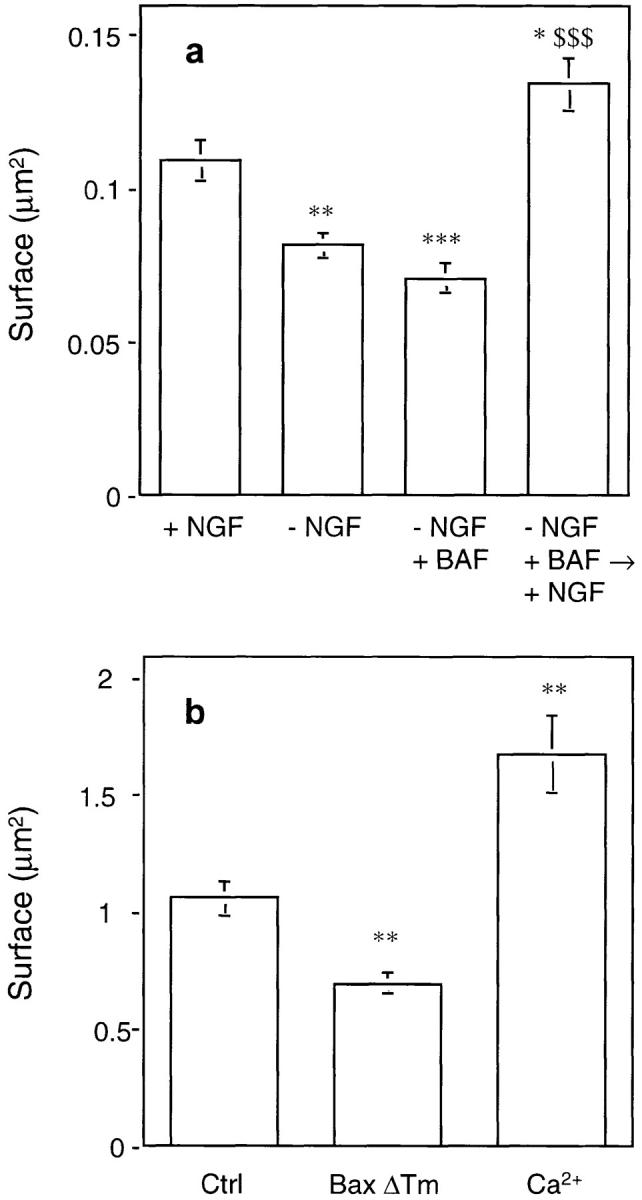
Figure 5.

Quantification of mitochondria size. (a) The size of mitochondria from neurons cultured in the conditions described in Fig. 4 was measured using micrographs printed at the same enlargement from negatives taken at original magnification of 11,500. The cross-sectional area of 80–120 mitochondria from five to 10 cells was measured, using NIH Image program (v. 1.58), and the mean area as well as other parameters were calculated using Kaleidagraph program (v. 3.08d). Data represent mean ± SEM for 80–120 mitochondria analyzed. *, P < 0.05; **, P < 0.01; ***, P < 0.001; significantly different from values obtained with + NGF. $$$, P < 0.001; significantly different from values obtained with –NGF + BAF (analysis of variance [ANOVA] followed by Bonferroni's test). (b) Mitochondria from mouse liver were incubated for 30 min at 30°C in the presence of 5 μM BaxΔTm or 100 μM free calcium before ultrastructural analysis (see also Fig. 6). The mitochondrial cross-sectional area was measured as described in a. Results represent mean ± SEM for 60–110 mitochondria analyzed. **, P < 0.01; significantly different from control values (ANOVA followed by Bonferroni's test).
