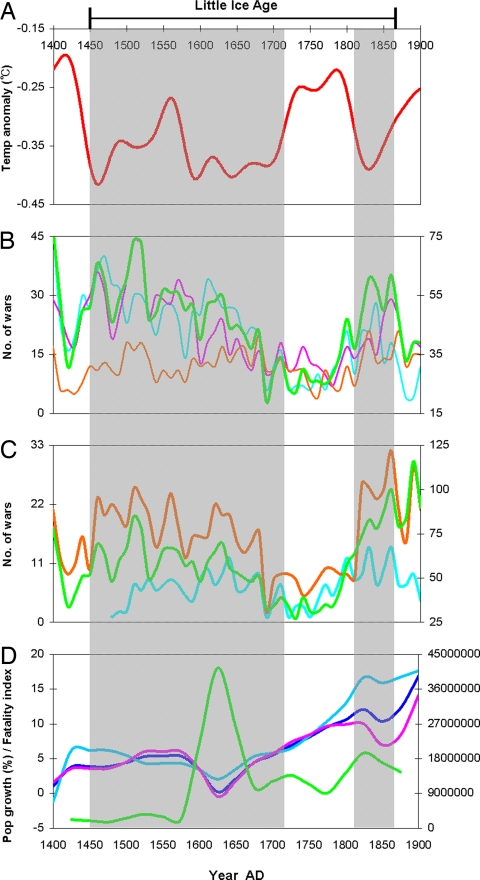
Fig. 1.
Paleo-temperature variation, war frequency, and population growth rate, A.D. 1400–1900. (A) Temperature anomaly (°C) in the NH that is smoothed by 40-year Butterworth low pass filter (17). (B) Number of wars in the NH (bright green), Asia (pink), Europe (turquoise), and the arid areas in the NH (orange).‖ (C) Number of wars worldwide as recorded by Wright (39) (turquoise), Luard (38) (orange), and Brecke‖ (bright green). (D) Twenty-year population growth rate in Europe (turquoise), Asia (pink), and the NH (blue)‖ and the NH 50-year fatality index (bright green). Cold phases are shaded as gray stripes. All war time series are in 10-year units, and the data are listed in SI Table 1. The bright green curves correspond to the right y axis.

