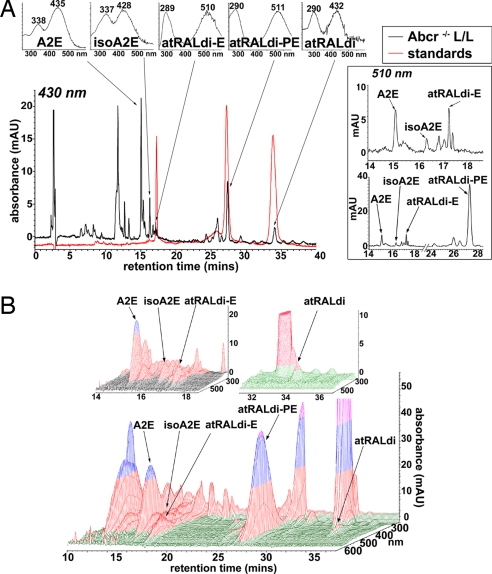
Fig. 2.
Two- and three-dimensional display of HPLC chromatograms demonstrating the detection of atRAL-derived lipofuscin chromophores in extracts of eyecups from Abcr−/− mice. Mice were homozygous for Rpe65 Leu-450 (11 months old; pooled sample of eight eyecups). (A Left Lower) HPLC chromatograms obtained when injectant was eyecup extract (black) and a mixture of three standards (red): atRAL dimer-phosphatidylethanolamine, atRAL dimer-E, and unconjugated atRAL dimer. C18 column, 430-nm monitoring, and a gradient of acetonitrile and water (acetonitrile:water = 85:15 → 100:0 for 15 min; 0.8 ml/min) with 0.1% of TFA was used for mobile phase. (A Left Upper) UV-visible absorbance spectra corresponding to A2E, isoA2E, atRALdi-E, atRALdi-PE, and atRAL dimer (atRALdi). (A Right) Monitoring at 510 nm with chromatogram expanded between retention times of 14–18 min (A Right Upper) and monitoring at 510 nm with chromatogram expanded between 14 and 28 min (A Right Lower). (B) Three-dimensional display of retention time, wavelength (270–600 nm), and photodiode array absorbance data obtained by HPLC for the chromatogram in A.

