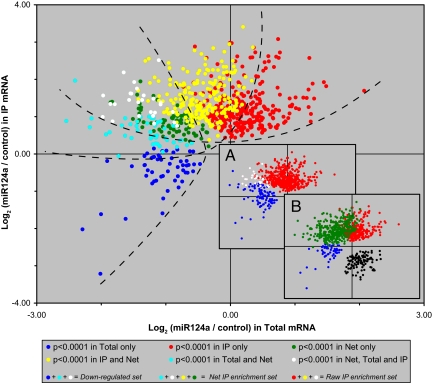
Fig. 3.
Probes that are significantly enriched or depleted in total RNA and miR-124a-programmed Ago2 IPs. (Inset A) Probes significantly down-regulated (adj. P < 0.0001) in total RNA (blue) and enriched in immunoprecipitated RNA (red) in miR-124a-transfected cells. The overlap is shown in white. (Inset B) As in Inset A, with probes identified by net miR-124a IP enrichment shown in green, and by converse, net GL3.1 IP enrichment shown in black. (Main figure) As in Inset B, but colored to show the overlap between blue and green (cyan), red and green (yellow), and blue and red (white). Dashed lines approximately delineate the Down-regulated, Net IP, and Raw IP sets for illustration purposes.

