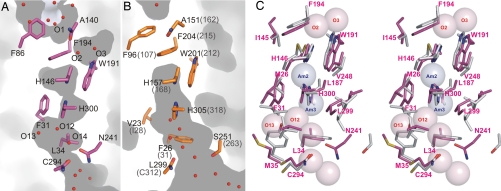
Fig. 5.
Substrate conduction pathway of NeRh50 and AfAmt1/EcAmtB. (A and B) Cross-sections cutting the pores of NeRh50 (A) and AfAmt1 (B) (6). The dark areas represent cavities after removing all water molecules from the structure models. The side chains of conserved pore residues are shown as sticks, and water molecules are shown as red spheres. Af-Amt1 is shown here because it is better suited to compare hydration of the cytoplasmic vestibules (EcAmtB structures are affected by disorder, bound detergent, or bound GlnK in that region). The pore shape is very similar to that observed for EcAmtB, whose residue numbers are given in parentheses. (C) Stereoview of the superposed central pore lining residues of NeRh50 (magenta) and EcAmtB [gray, from D subunit of PDB ID code 2NUU (35)]. Selected residues of NeRh50 are labeled. Transparent spheres (1.4-Å radius) represent observed water sites in NeRh50 (O2, etc., light magenta) and the putative NH3 sites Am2 and Am3 in EcAmtB (7).

