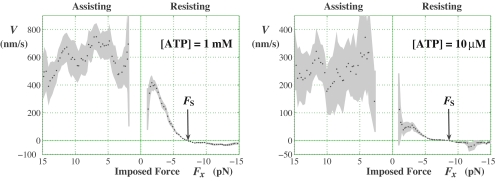
Fig. 2.
Velocity vs. load for kinesin derived from observations of Carter and Cross (6). Detailed data for the fractions of forward and backward steps, π+ and π−, and corresponding dwell times, τ, as functions of a running (1.5 pN)-bin averaged force yield the velocity via V = d(π+ − π−)/τ (11, 12), where d = 8.2 nm represents the kinesin step size. The gray shading indicates the confidence intervals based on the number of observations.

