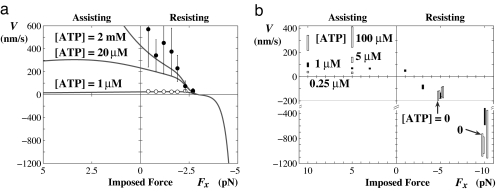
Fig. 3.
Myosin V. (a) Substall data derived from Mehta et al. (13) fitted to a two-state kinetic model by Kolomeisky and Fisher (14) (evaluated here also for [ATP] = 20 μM). Note the factor of 2 scale change for negative, superstall velocities. (b) The velocity under superstall and large assisting loads [after Gebhardt et al. (15)]. The solid symbols represent data for [ATP] = 1 μM; those for Fx = −(5 and 10) pN have been narrowed and displaced slightly to distinguish data for [ATP] = 0, 0.25 μM up to 0.1 mM. Note the scale change for V < −200 nm/s.

