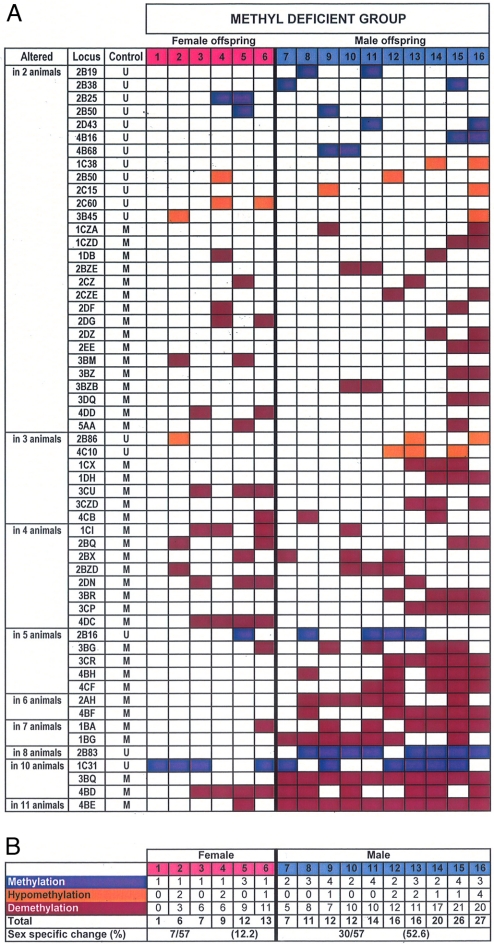
Fig. 4.
RLGS of DNA methylation differences between control and MD liver at fetal day 90. (A) The unique identifier codes (locus) of fragments that varied between each MD individual and all of the controls are shown. RLGS fragments that varied among control-group individuals were not scored to minimize scoring of genetic polymorphisms as DNA methylation differences. “Control” indicates whether each locus was methylated (M) or unmethylated (U) in the control group. Data representing the loci that differed from the control group in 2–11 MD individuals are presented in ascending order. Blue boxes indicate loci methylated in the indicated MD individuals and unmethylated in all controls. Purple boxes indicate MD loci unmethylated in MD individuals and methylated in controls. Orange boxes indicate MD loci hypomethylated in MD individuals. (B) Summary of methylation differences between the control group and the MD individuals.

