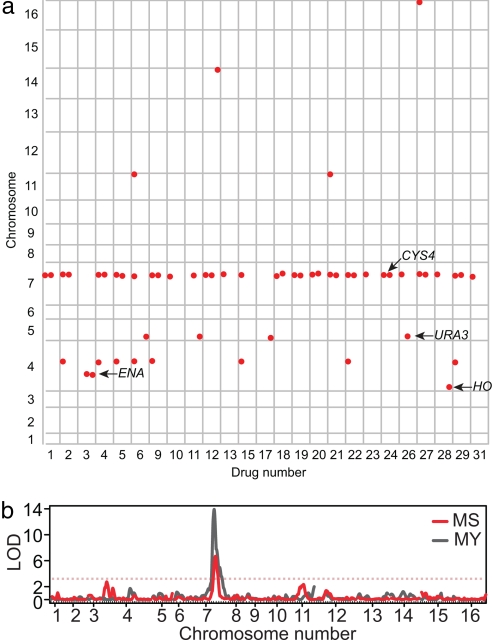
Fig. 2.
QTL identified by genome scans of 31 drug-sensitivity phenotypes. (a) QTL identified for each drug across the 16 chromosomes. Significant QTL (1% FDR) were plotted as red circles at the chromosomal position (vertical axis) for 27 drugs for which at least one QTL was identified (horizontal axis). Each drug column is divided into three subcolumns that indicate QTL identified in the MY, MS, and YS crosses, respectively. Drug names corresponding to each number are given in SI Table 3. (b) Genome scan showing linkage (lod score) to atenolol sensitivity in the MS cross (red) and in the MY cross (gray). Red and gray dotted lines indicate the lod score cutoff at a FDR of 1% for the MS and MY cross, respectively.

