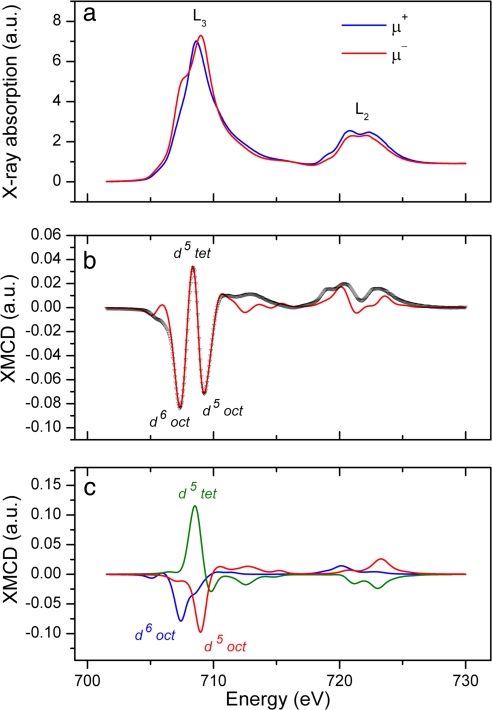
Fig. 3.
XAS and XMCD spectra obtained from the fully mature magnetosomes 24 h after induction. (a) Spectra shown are the absorption curves obtained with the magnetic field applied parallel (μ+) and antiparallel (μ−) to the x-ray beam. The positions of the L2 and L3 absorption peaks are indicated. (b) Experimental XMCD spectrum (black curve) taken as the difference of the two absorption curves, together with the calculated best fit (red curve). Features in the XMCD corresponding to the different Fe sites in magnetite are labeled. (c) Calculated XMCD components for each Fe site, which were used to obtain the best fit to the experimental XMCD.

