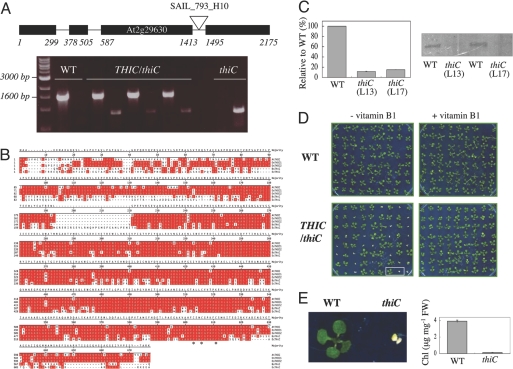
Fig. 1.
Arabidopsis THIC characteristics. (A) (Upper) Exon–intron structure of Arabidopsis THIC indicating the location of the SAIL_793_H10 insertion. (Lower) PCR analysis indicating plant genotypes employing primer pairs specific for either WT or the T-DNA insertion in thiC, respectively. From left to right: molecular marker, WT, three lines heterozygous for thiC, and a homozygous line (L13). (B) Amino acid sequence alignment of THIC homologs identified in Arabidopsis thaliana (At), Oryza sativa (Os), Bacillus subtilis (Bs), and Escherichia coli (Ec). Amino acids identical in at least two of the sequences are shaded in red. The asterisk denotes the identified C(X)2C(X)4C motif. (C) (Left) Quantitative RT-PCR of THIC transcript in WT or thiC plants. The values indicated are the percentage mRNA levels relative to WT (value = 100). Error bars indicate the standard deviation of the experiment performed in triplicate. (Right) Western blot analysis of the same samples probed with a THIC antibody. L13 and L17 refer to lines 13 and 17, respectively. (D) thiC mutant phenotype. (Left) WT and progeny of selfed THIC/thiC plants grown in sterile culture lacking vitamin B1. Approximately one quarter of the population shows a pale green phenotype and does not develop beyond the cotyledon stage. (Right) Supplementation with vitamin B1 (0.5 μM) restores growth of thiC to that of WT. Ten-day-old seedlings grown under long day conditions. (E) (Left) Enlarged picture of two seedlings from D. (Right) Total chlorophyll content (Chl) of WT and thiC (L13) under the same conditions. Error bars indicate the standard deviation of three independent experiments.

