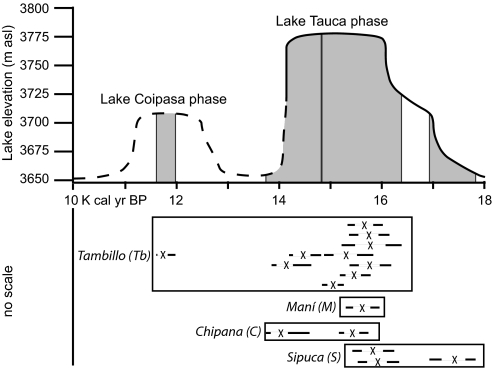
Fig. 4.
Comparison of the Tauca and Coipasa lake cycles (44) with dated organic material from fluvial deposits of the PdT from four separate drainages as part of this study. X, median probability calibrated age. White and black bars represent 95% and 67% confidence intervals, respectively. The gray shading illustrates the 95% 14C confidence intervals from our 16 Pleistocene dates. The dashed line indicates the portion of this lake level curve considered to be slightly less well constrained by the original authors (44).

