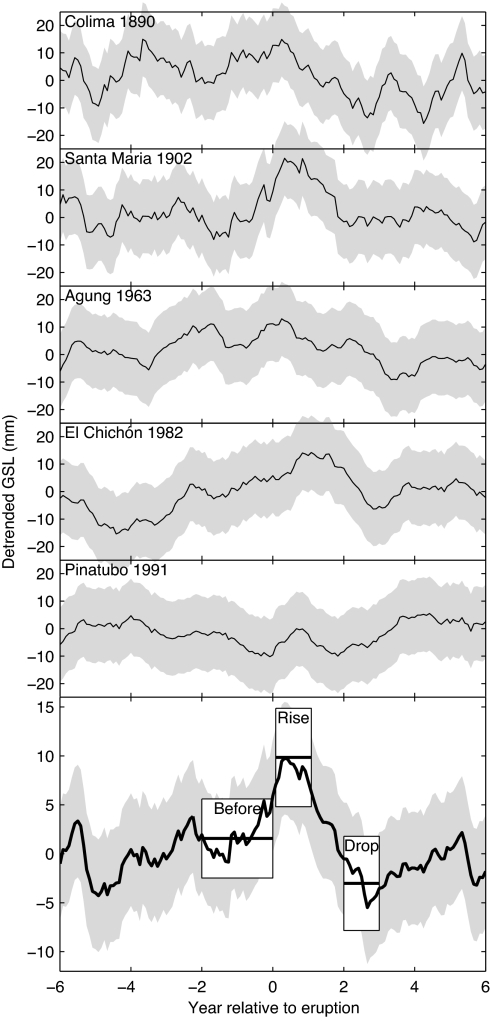
Fig. 4.
Sea level surrounding five major volcanic eruptions and the average sea level in these five periods. The solid black curves show nonlinearly detrended (10-year lag) (see ref. 12) GSL as observed in tide gauge records (gray shows 95% confidence interval). Boxes show the median sea level (center line of box) of the “Before,” “Rise,” and “Drop” windows. Top and bottom edges of the boxes show the 95% confidence interval of the median.

