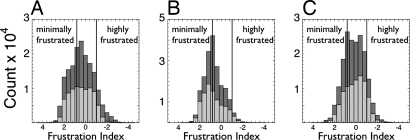
Fig. 2.
Histograms showing the distribution of the mutational frustration index (light gray) and the configurational frustration index (dark gray) in the three different contact classes considered. These frustration indices were computed for every native contact present in a database of 314 monomeric protein domains. (A) Short-range contacts. (B) Long-range contacts. (C) Water-mediated contacts. The vertical lines indicate the energy landscape theory-based cutoff used to define minimally frustrated interactions as well as the cutoff for neutral or highly frustrated interactions.

