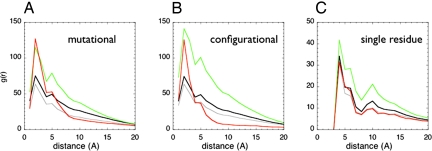
Fig. 3.
The pair distribution functions between the centers of mass of the contacts was calculated for a database of 314 monomeric proteins (black). The distributions for minimally frustrated (green), neutral (gray), or highly frustrated contacts (red) are shown both for each class using the mutational frustration index (A), the configurational frustration index (B), or the single-residue-level frustration index (C). For the single-residue-level frustration index, the distance between Cα atoms was used.

