Fig. 5.
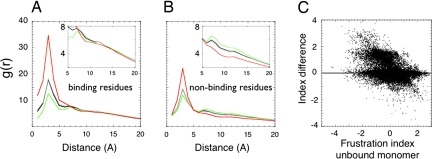
Frustration distribution in protein assemblies. (A and B) The pair distribution functions between the center of mass of contacts classified by their frustration index (minimally frustrated in green, neutral in gray, or highly frustrated in red) to the Cα of either binding (A) or the surface residues not involved in binding (B) are shown. (C) The change of the configurational frustration index upon binding for the contacts close to the binding site in all of the complexes analyzed.

