Fig. 1.
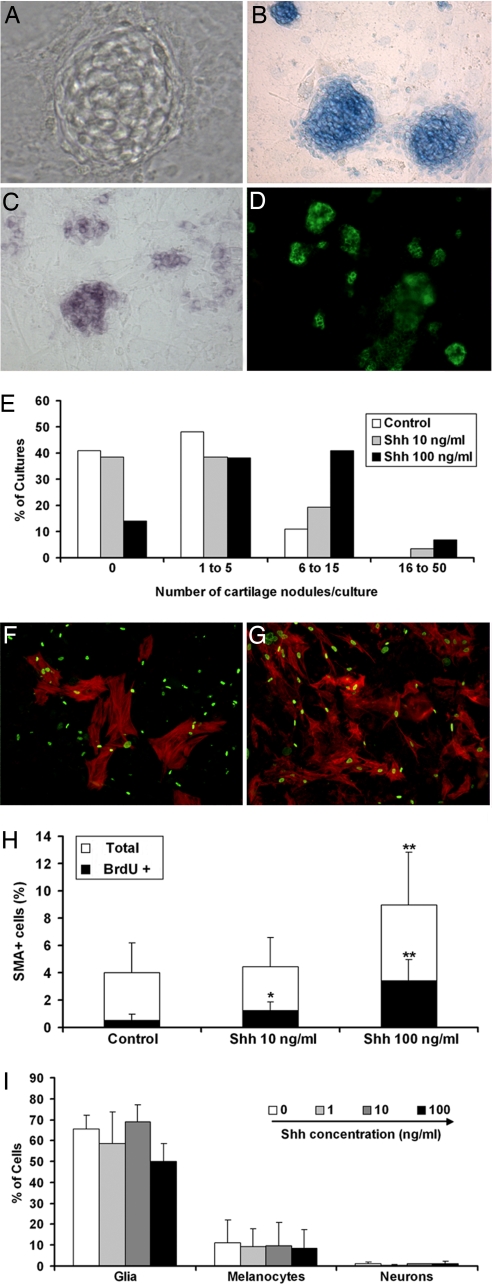
Influence of Shh treatment in CNCC mass cultures. Phenotype analysis in d6 cultures of mes-rhombencephalic NCCs grown in the absence and presence of Shh. (A–E) Chondrocytes are identified by phase-contrast microscopy (A), Alcian blue staining (B), expression of Sox9 transcripts (C), and immunoreactivity to chondroitin sulfate (D). (Magnification: A, ×200; B–D, ×55.) (E) Quantification of chondrogenesis is given by the number (%) of cultures containing indicated numbers of cartilage nodules per culture (n = 119, 135, and 138 cultures in control, 10 ng/ml Shh, and 100 ng/ml Shh, respectively). (F and G) Labeling of myofibroblasts with αSMA (red) and BrdU nuclear incorporation (green) in control (F) and 100 ng/ml Shh-treated (G) cultures. (H) The total number of αSMA+ cells and the number of BrdU+ αSMA+ cells are given as mean % (± SEM) of total CNCCs in control and Shh-containing media (n = 25; *, P < 0.05; **, P < 0.001). (I) Quantification of glia, melanocytes, and neurons (see Materials and Methods) is shown as mean % (± SEM) of CNCCs for each phenotype in Shh-treated and untreated cultures.

