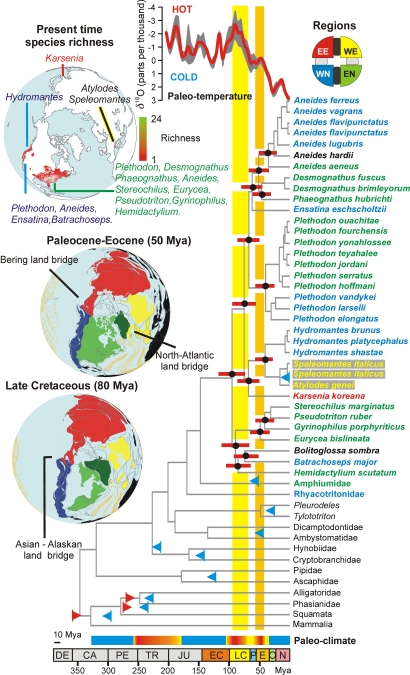
Fig. 2.
Chronogram for the taxa analyzed. Data were calculated with MULTIDIVTIME using a prior of 20 mya for rttmsd, a bigtime of 420 mya, and lower fossil constraints. Branch lengths are proportional to time units. Red bars represent 95% confidence intervals; blue and red triangles represent minimum and maximum fossil time constraints, respectively. At the top right, a color-coded wheel represents the four main regions considered: EE (red), eastern Eurasia; WE (yellow), western Eurasia; EN (green), eastern North America; WN (blue), western North America. The same color-coding scheme was applied to species names and paleogeographic reconstructions for the Paleocene–Eocene and Late Cretaceous (shown at left). Tectonic plates and ocean isochrones are overlapped in gray and orange, respectively (29). Actual species richness for the Holarctic plethodontid genera is represented at top left. All geographic reconstructions are orthographically projected, with −60° set as the central meridian and 85° set as the reference latitude. At the top of the chronogram is a chart representing the evolution of the deep-sea oxygen δ18 isotope across time, with the smoothed mean highlighted in red and the 75% interval in gray. Paleoclimate is indicated by a bar at the bottom coded from blue to red, representing glaciations and cold-to-hot periods, respectively. Time scale is shown at the bottom, with letters representing geologic periods (DE, Devonian; CA, Carboniferous; PE, Permian; TR, Triassic; JU, Jurassic; EC, Early Cretaceous; LC, Late Cretaceous; P, Paleocene; E, Eocene; O, Oligocene; N, Neogene).

