Abstract
Kinase inhibitors constitute an important new class of cancer drugs, whose selective efficacy is largely determined by underlying tumor cell genetics. We established a high-throughput platform to profile 500 cell lines derived from diverse epithelial cancers for sensitivity to 14 kinase inhibitors. Most inhibitors were ineffective against unselected cell lines but exhibited dramatic cell killing of small nonoverlapping subsets. Cells with exquisite sensitivity to EGFR, HER2, MET, or BRAF kinase inhibitors were marked by activating mutations or amplification of the drug target. Although most cell lines recapitulated known tumor-associated genotypes, the screen revealed low-frequency drug-sensitizing genotypes in tumor types not previously associated with drug susceptibility. Furthermore, comparing drugs thought to target the same kinase revealed striking differences, predictive of clinical efficacy. Genetically defined cancer subsets, irrespective of tissue type, predict response to kinase inhibitors, and provide an important preclinical model to guide early clinical applications of novel targeted inhibitors.
Advanced epithelial tumors are largely refractory to curative treatment with conventional chemotherapy drugs, which remain the standard therapy for these cancers. Although it has been suggested that their genetic complexity may render them resistant to pharmacologic treatment, recent findings indicate that many solid tumors are “addicted” to particular mutationally activated kinases and that targeting such kinases with selective inhibitors provides an important treatment paradigm. This phenomenon of “oncogene addiction” (1) appears to underlie the clinical success of several selective kinase inhibitors, including imatinib, trastuzumab, gefitinib, and erlotinib (2).
Although kinase inhibitors hold much promise for cancer therapy, their successful application requires preclinical strategies to identify molecular markers that define susceptible subtypes, which may constitute small fractions among common epithelial cancers. Analysis of tumor-derived cell lines provides an effective, manipulable system for establishing the link between specific tumor genotypes and the response to molecularly targeted drugs. Indeed, recent findings indicate that breast cancer-derived cell lines faithfully recapitulate the genomic features of primary tumors, with trastuzumab sensitivity correlating with HER2 gene amplification (3), indicating that clinically observed genotype-associated drug sensitivities can be successfully modeled in cancer cell lines.
We reasoned that high-throughput analysis of a large number of tumor cell lines representing the broad genetic heterogeneity in human cancer could provide a robust system for preclinical assessment of novel targeted drugs. Therefore, we developed a system for determining sensitivity to putative anticancer compounds in a large collection of human cancer cell lines representing diverse tumor histologies. Genotype-dependent drug susceptibilities were readily apparent through this strategy. This broadly generalizable approach allows for effective preclinical screening of novel agents and reveals previously unrecognized subsets of tumors likely to respond to established anticancer drugs.
Results
Establishment of a High-Throughput Cancer Cell Line Profiling Platform.
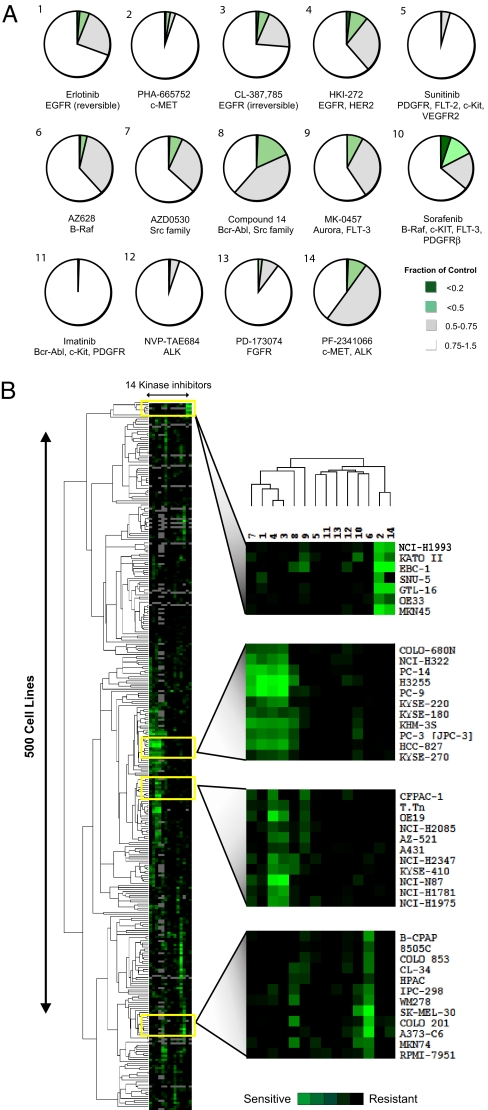
To capture the broad genetic heterogeneity inherent among various cancers, we developed an automated platform to examine the sensitivity of 500 solid tumor-derived human cell lines to 14 selective kinase inhibitors, including FDA-approved and investigational drugs [supporting information (SI) Figs. 6 and 7]. The majority of cell lines were largely “refractory” to each inhibitor, but for most inhibitors, a small subgroup of exquisitely sensitive cell lines could be readily identified (Fig. 1A). Hierarchical clustering of sensitivity data revealed that cell lines could be grouped according to their response profile to multiple inhibitors, with overlapping sensitivity to related compounds (Fig. 1B). These findings are consistent with clinical data indicating that selective kinase inhibitors typically produce clinical responses in a relatively small fraction of treated patients.
Fig. 1.
Profiling 500 tumor cell lines with a variety of selective kinase inhibitors reveals a wide range of sensitivities for most compounds. (A) Pie chart representation of the sensitivity of 500 cancer cell lines to inhibitors of the indicated kinases after treatment for 72 h. Sensitivity is calculated as the fraction of viable cells relative to untreated controls. The complete set of sensitivity data is presented in SI Fig. 18. (B) Hierarchical clustering of the sensitivity of 500 human cancer cell lines to a single concentration of each of the 14 protein kinase inhibitors indicated in A. The concentration selected for each compound was that which most clearly discriminated between sensitive and resistant cell lines. The “subclusters” with the highest correlation coefficients are displayed adjacent to the clustering profile and are further explored in Results. The kinase inhibitors are numbered as indicated in A. The subclusters highlight (from top to bottom) those compounds targeting MET, EGFR, HER2, and BRAF, with correlation coefficients of 0.85, 0.92, 0.86, and 0.87, respectively. The sensitivity of each cell line is indicated by the increasing intensity of the green signal. Resistant cell lines are indicated in black. Cell lines not screened with a particular compound are indicated in gray.
Responsiveness to Erlotinib in EGFR Mutant Cell Lines.
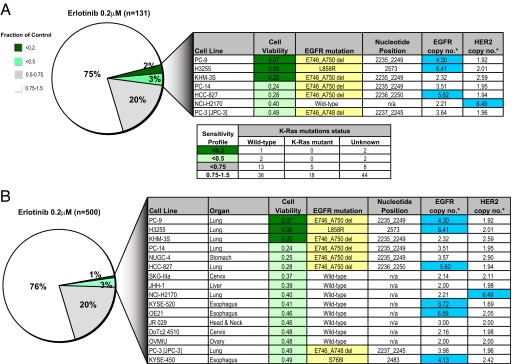
To determine whether high-throughput tumor cell line profiling could be used to model the genotype-correlated drug sensitivity observed clinically with several kinase inhibitors, we first tested erlotinib, an EGFR kinase inhibitor whose clinical activity is well correlated with activating EGFR kinase domain mutations in ≈10% of non-small-cell lung cancers (NSCLCs) (4). Among 131 NSCLC lines profiled, 98 (75%) are insensitive to erlotinib, whereas 26 (20%) display minimal growth inhibition, and 7 (5%) exhibit exquisite sensitivity (Fig. 2A). Of these highly sensitive lines, six harbor activating EGFR mutations, whereas the seventh has HER2 gene amplification, which has also been correlated with erlotinib responses in NSCLC (5). These lines were determined to be genetically distinct by using comparative SNP-based “fingerprinting” (SI Fig. 8). Among the erlotinib-insensitive lines, 96 of 98 examined harbor wild-type EGFR. Overall, there was a highly significant correlation between the presence of activating EGFR mutations and sensitivity to erlotinib (P < 0.001). The remaining two lines harbor EGFR mutations in the context of the known T790M drug-resistance mutation (NCI-H1975) or deletion of PTEN, a known modulator of cell survival (NCI-H1650). As reported (6), mutations in EGFR and KRAS are mutually exclusive, and no erlotinib-sensitive cell lines harbor KRAS mutations (Fig. 2A). Thus, analysis of NSCLC-derived cell lines recapitulates clinical observations with respect to genetically defined subsets susceptible to EGFR inhibitors.
Fig. 2.
Profiling for erlotinib sensitivity reveals EGFR genotype-correlated sensitivity in multiple tissue types. (A) Pie chart representation of the sensitivity of 131 human lung cancer cell lines to treatment with 200 nM EGFR kinase inhibitor erlotinib. The drug effect was calculated as the fraction of untreated cells present after 72 h of treatment. Details regarding the most sensitive cell lines identified are shown in the chart. EGFR mutations are highlighted in the table in yellow, and amplifications (copy no. > 4) are highlighted in blue. The mutation status of K-Ras (the Lower chart) was obtained from the Wellcome Trust Sanger Institute web site, and K-Ras mutants were present only in the erlotinib-insensitive lines. (B) Pie chart representation of the sensitivity of 500 human cancer cell lines to treatment with 200 nM erlotinib. The drug effect was calculated as the fraction of untreated cells present after 72 h of treatment. Details regarding the most sensitive cell lines identified are shown in the chart, and the cell lines are shown in order of decreasing sensitivity (from top to bottom) (*, copy numbers were estimated from SNP array profiles). EGFR mutations are highlighted in the table in yellow, and amplifications (copy no. > 4) are highlighted in blue.
We extended the profiling to an additional 369 cell lines derived from other tissues. Again, the vast majority of lines were erlotinib-insensitive (Fig. 2B), consistent with data indicating that EGFR mutations and clinical responses arise at very low frequency outside of NSCLC. However, 9 of 369 (2%) additional drug-sensitive cell lines were identified, derived from esophageal, ovarian, head and neck, cervical, liver, and stomach cancers. Of these nine cell lines, two had erlotinib-sensitizing EGFR mutations (Nugc-4 and Kyse-450) (7), and two others had high-level amplification of wild-type EGFR, a known determinant of erlotinib sensitivity in lung cancer (8) (Fig. 2B; SI Fig. 9). Thus, of the 16 most erlotinib-sensitive cell lines identified, 11 harbor either EGFR mutations or EGFR/HER2 gene amplification—a highly significant correlation with sensitivity to erlotinib (P < 0.001). In EGFR-mutated cell lines not derived from NSCLC, erlotinib sensitivity is well correlated with its ability to suppress EGFR signaling to survival effectors (SI Fig. 10), suggesting that, as in erlotinib-sensitive NSCLCs, activated EGFR is coupled to downstream survival signals in these additional cancer types. Thus, high-throughput screening of cancer cell lines for erlotinib sensitivity faithfully recapitulates the genotype-correlated drug responses observed clinically in NSCLC and suggests that these may extend to genetically defined subsets of other epithelial cancers.
Sensitivity to an Inhibitor of the Growth Factor Receptor MET.
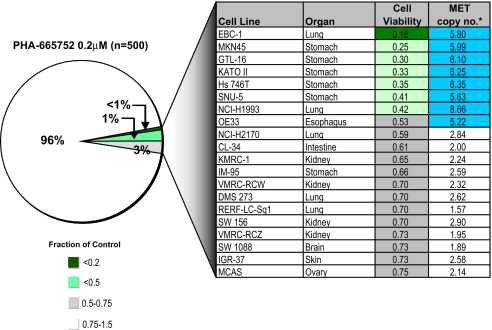
Amplification of the MET tyrosine kinase gene occurs in ≈20% of gastric cancers and has been well correlated with sensitivity to the selective MET kinase inhibitor PHA665752 in gastric cancer cell lines (9). Profiling 500 tumor cell lines readily identified the five gastric cancer lines in the panel with amplified MET among the seven most PHA665752-sensitive lines (Fig. 3). However, the most sensitive line was a NSCLC line (EBC-1) that also harbors substantial MET amplification. These cells express phospho-MET, and PHA665752 treatment efficiently suppresses MET signaling (SI Fig. 11 A and B). A second NSCLC line (H1993) with high-level MET amplification is also very sensitive to PHA665752 treatment, consistent with a recent report (10). Ranking the tested cell lines according to MET amplification revealed a strong correlation with drug sensitivity (P < 0.001) (SI Fig. 12). In the few lines in which MET amplification was not linked to drug sensitivity, further analysis revealed either absent MET expression or failure of MET to couple to downstream survival signals (SI Fig. 11 C and D). Together, these findings suggest that sensitivity to MET inhibition is strongly linked to MET amplification in gastric cancer as well as in a smaller subset of lung and esophageal cancers.
Fig. 3.
Sensitivity to a MET kinase inhibitor is well correlated with MET gene amplification. Pie chart representation of sensitivity of 500 human cancer cell lines to treatment with 200 nM MET-selective kinase inhibitor PHA665752. The drug effect was calculated as the fraction of untreated cells present after 72 h of treatment. The most sensitive cell lines are detailed in the chart together with their MET gene copy number (*, copy numbers were estimated from SNP array profiles). Those cell lines exhibiting MET amplification (copy no. > 4) are highlighted in blue.
Sensitivity to an Investigational B-RAF Inhibitor.
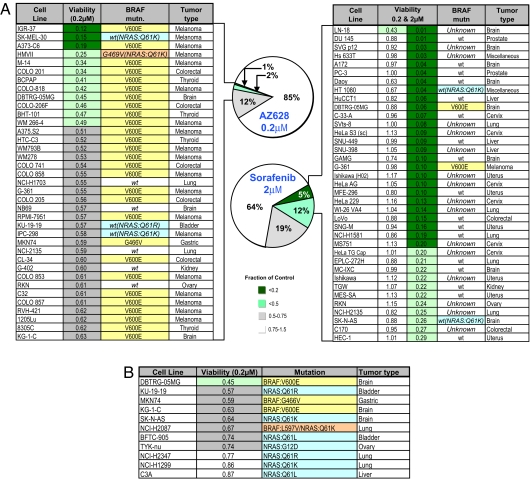
The discovery of recurrent BRAF kinase mutations in 70–80% of melanomas is among the most significant discoveries of cancer kinome sequencing efforts (11). Somatic BRAF mutations are most frequently seen in melanomas (70–80%), thyroid cancers (40%), and colorectal cancers (20%) (11), and a recurrent kinase domain mutation, V600E, accounts for 90% of BRAF mutations (12). However, clinical trials of a putative BRAF inhibitor, sorafenib, failed to demonstrate responses in melanoma (13). Profiling sorafenib against 500 cell lines demonstrated limited activity (Fig. 4A) and was primarily seen in tumor cells not typically associated with BRAF mutations. In marked contrast, a similar analysis of AZ628, an investigational selective BRAF inhibitor (IC50 for WT BRAF 2.14 μM, mutant BRAF 196 nM) revealed remarkable sensitivity among melanoma, thyroid, and colorectal cancer cell lines. Thus, 28 of 37 of the most sensitive cell lines belonged to these three tumor types, and 29 of these lines harbor BRAF mutations (Fig. 4A). Significantly, four of the remaining sensitive lines harbor an activating mutation in NRAS, a functional component of this pathway. Among the AZ628-insensitive cell lines (white category), only nine lines with BRAF V600E mutation and five with NRAS mutations were present among 241 genotyped lines. Overall, NRAS mutations were correlated with AZ628-sensitivity (nine occurrences in the 15% most sensitive lines and only five occurrences in the remaining 85% insensitive lines; Fig. 4 and SI Fig. 13). Rare AZ628-sensitive lines from lung, brain, bladder, gastric, kidney, and ovarian cancer, were also identified, with several harboring BRAF or NRAS mutations (Fig. 4 A and B). No mutations in HRAS or KRAS are present among the AZ628-sensitive lines. Comparing AZ628 and sorafenib, mutations in BRAF or NRAS were found in 86% (32 of 37) of the AZ628-sensitive lines (top 7%), whereas they were present in only 11% (4 of 37) of the sorafenib-sensitive lines (top 7%) (P < 0.001) (Fig. 4A). Moreover, there was virtually no overlap in the cell line sensitivity profile to AZ628 and sorafenib, underscoring functional differences.
Fig. 4.
Sensitivity to a selective BRAF kinase inhibitor is well correlated with BRAF mutational status in tumor cell lines, irrespective of tissue of origin. (A) Pie chart representation of the sensitivity of 500 human tumor cell lines to treatment with 200 nM BRAF inhibitor AZ628 and 2 μM sorafenib for 72 h. The drug effect was calculated as the fraction relative to untreated controls, and values for the top 7% of responders were tabulated, as shown in the chart. The mutational status of BRAF, where known, is indicated. The tumor type is also indicated. For comparison, the sorafenib table also shows the sensitivity of cell lines to 200 and 2 μM sorafenib. The only sorafenib-sensitive cell lines with a V600E mutation in BRAF (melanoma G-361) were also sensitive to AZ628. However, the sensitivity of G-361 placed it at position 57, which falls outside of the top 34 AZ628-sensitive cell lines shown in the table. (B) Sensitivity to AZ628 of nonmelanoma cell lines harboring BRAF or NRAS mutations.
These observations also indicate the importance of the BRAF genotype. Thus, melanoma cells lacking the V600E BRAF mutation are largely AZ628-insensitive, as are cell lines with distinct BRAF mutations, such as G466V and G469A (exon 11) (SI Fig. 13). In the cell line panel, exon 11 mutations of BRAF featured in only five lines, four of which were AZ628-insensitive. Biochemical studies revealed that AZ628 sensitivity is well correlated with its ability to suppress the downstream pathway component, ERK (SI Fig. 13). Sensitivity to MEK inhibition has been correlated with BRAF mutations in tumor cell lines (14). Consistent with cell line sensitivity findings, we observed that, in BRAF mutant melanoma cells, ERK activation is suppressed by a MEK inhibitor but not by sorafenib (SI Fig. 13). Our results predict that clinical responses to selective BRAF inhibitors are likely to appear in multiple tumor types, specifically in tumor subsets that harbor the BRAF V600E mutation and in a significant fraction of NRAS mutant tumors.
Tumor Cell Line Profiling Reveals Similarities Between Compounds with Putatively Distinct Targets.
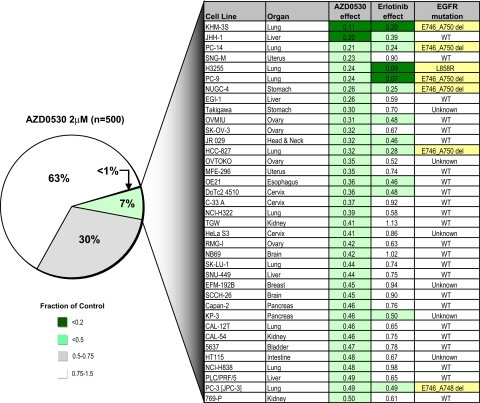
Whereas the comparison of AZ628 and sorafenib highlights the value of this strategy to reveal differences between two compounds thought to have a common target, the converse is also true. Among the tested inhibitors, KIN001–045 (also known as AZD0530) is a dual Src/ABL inhibitor undergoing Phase 1 clinical testing (15). However, hierarchical clustering data (Fig. 1B) revealed that AZD0530 is one of four inhibitors (along with erlotinib, HKI-272, and CL-387,785) that exhibit substantial overlap in activity against a common subset of cell lines. Although the other three inhibitors are known to target EGFR, AZD0530 had not been identified as an EGFR inhibitor. A direct comparison of sensitivity profiles for erlotinib and AZD0530 across 500 cell lines revealed substantial overlap (Fig. 5). Thus, 13 of 16 of the most erlotinib-sensitive cell lines are found within the top 8% of AZD0530-sensitive lines, and 7 of 8 of the EGFR mutant lines are within this group. Given this similarity, we tested the ability of AZD0530 to inhibit EGFR activity in two prototype EGFR mutant cell lines. Indeed, we observed potent suppression of EGFR and downstream signaling, comparable with that seen with erlotinib (SI Fig. 14), confirming that AZD0530 is an effective EGFR inhibitor in tumor cells at a clinically achievable concentration (15). Notably, the AZD0530-sensitive cell lines are refractory to several other tested Src inhibitors, indicating that their response is not due to Src inhibition (data not shown). These results indicate that high-throughput cancer cell line profiling can identify unsuspected functional relationships among distinct kinase inhibitors, findings that may have substantial impact on clinical testing strategies.
Fig. 5.
Sensitivity to a Src/ABL kinase inhibitor demonstrates overlap with erlotinib sensitivity and EGFR mutation status. Pie chart representation of the sensitivity of 500 human cancer cell lines to treatment with 2 μM Src/ABL kinase inhibitor AZD0530. The drug effect was calculated as the fraction of untreated cells present after 72 h of treatment. The most sensitive cell lines are detailed in the chart together with their sensitivity to a similar duration of treatment with 200 nM EGFR inhibitor erlotinib, including their EGFR kinase domain mutation status where known.
Discussion
We have described the profiling of a large panel of cell lines derived from a broad range of human cancers to reveal subsets with extreme sensitivity to selective kinase inhibitors. Using this approach, we confirmed clinically observed genotype-response correlations, and we established additional correlations that predict tumor subsets likely to respond to novel inhibitors. This platform may provide an important preclinical approach to guide the design of early-phase clinical trials in which patients are stratified for treatment based on genotypes.
Significantly, despite their prolonged culture history, most cancer cell lines clearly retain genetic features that relate to their original driving oncogenes, faithfully recapitulating clinical responses to inhibitory drugs. Typically, preclinical analysis of novel anticancer compounds involves testing them on a small number of cancer cell lines, and our findings suggest that this will generally be insufficient for capturing the genetic heterogeneity that appears to underlie clinical sensitivity to targeted kinase inhibitors.
Our findings highlight the importance of verifying the biological activity of novel inhibitors, as demonstrated by two striking examples relating to recent clinical trials. First, the correlation between EGFR mutations and sensitivity to EGFR kinase inhibitors is readily evident in the cancer cell line analysis. Establishing this genotype–therapeutic relationship preclinically would likely have altered the initial clinical trials of gefitinib, directing them toward selected patient cohorts most likely to respond. Gefitinib was recently withdrawn in the U.S. for failure to demonstrate clinical benefit in a large clinical trial of unselected NSCLCs (16). Second, the discovery of recurrent BRAF mutations in most melanomas was followed by clinical trials showing minimal responses to the first available putative BRAF inhibitor, sorafenib, thereby raising doubts about the therapeutic significance of BRAF mutations (13). However, our analysis clearly demonstrates that melanoma cell lines harboring the V600E BRAF mutation are exquisitely sensitive to AZ268, an investigational BRAF inhibitor, whereas sorafenib is inactive against the vast majority of these lines. Again, a preclinical testing strategy to identify such genotype-associated sensitivities would have predicted the lack of clinical efficacy of sorafenib.
High-throughput cell line profiling can also reveal other unanticipated properties of investigational anticancer agents. For example, we found that AZD0530, a putative Src/ABL inhibitor currently undergoing early phase clinical study, exhibits a sensitivity profile remarkably similar to that of several selective EGFR inhibitors, thereby revealing its activity as an EGFR inhibitor, a finding that could significantly impact the design of Phase II clinical studies.
Although the genotype-correlated sensitivities to kinase inhibitors observed in our profiling platform are very strong, they are not absolute. Similarly, these correlations are imperfect in clinical studies of currently available kinase inhibitors (4). In some cases, kinase activity appears to have been uncoupled from survival pathways. In these cases, additional oncogenes may contribute to survival, potentially necessitating inactivation of multiple kinases to induce cell killing. The recent demonstration of secondary MET gene amplification in EGFR-mutant NSCLC with acquired erlotinib resistance illustrates this mechanism (17).
Perhaps the most provocative observation from our analysis is the detection of low-frequency drug-sensitizing genotypes outside of expected histologically defined cancer types. For example, our analysis of a MET kinase inhibitor points to its potential utility in a subset of esophageal and lung cancers, in addition to the ≈20% of gastric cancers with MET gene amplification (9, 18). We also found that HER2 gene amplification is well correlated with sensitivity to a HER2 inhibitor (P < 0.001) and suppression of downstream signaling by drug treatment, not only in the ≈20% of breast cancers known to have this genotype but also in a small percentage of esophageal (18%), lung (7%), and gastric (4%) cancers that also display HER2 amplification (SI Fig. 15). Our findings with a selective BRAF inhibitor revealed a strong correlation between BRAF mutational status and sensitivity, irrespective of tissue type, again highlighting the potential importance of using this inhibitor in genotype-selected cancers, without consideration to tissue of origin. Our study suggests that BRAF inhibitors may prove effective in the subset of melanomas, colorectal, and thyroid cancers with V600E BRAF mutation, and at a lower frequency in BRAF mutant brain, gastric, and lung tumors. Finally, for EGFR mutations, drug responses are evident in cell lines from NSCLC (5%), esophageal (14%), and gastric (4%) cancers. Notably, dramatic responses to gefitinib or erlotinib have been reported outside of NSCLC, including a patient with head and neck cancer harboring a HER2 mutation (19) and two patients with EGFR-mutant ovarian cancer (20). Recognition that drug sensitizing mutations are distributed at low frequency across different types of cancer suggests that a primary genotype-based diagnostic strategy aimed at identifying these rare cases may have significant impact in the treatment of diverse human cancers.
Methods
Human Cancer Cell Lines.
Human cancer cell lines were obtained from the American Type Culture Collection (ATCC), the Deutsche Sammlung von Mikroorganismen und Zellkulturen GmbH (DSMZ), the Japanese Collection of Research Bioresources (JHSF), or the European Collection of Cell Cultures (ECACC). Cells were grown in RPMI medium 1640 or DMEM/F12 growth medium (GIBCO–Invitrogen) supplemented with 5% FBS and maintained at 37°C in a humidified atmosphere at 5% CO2.
Protein Detection.
Immunodetection of proteins after SDS/PAGE was performed by using standard protocols. Equal lane loading was assessed by using a β-tubulin antibody (Sigma). The Akt, Erk1/2, phospho-Erk1/2(T202/Y204), HER2, phospho-HER2 (Y1248), phospho-MET (Y1234/Y1235), STAT3 and phospho-STAT3 (S727) antibodies were from Cell Signaling Technology. The phospho-EGFR (Y1068) antibody was from Abcam. The phospho-Akt (S473) antibody was from BioSource International. The MET antibody (C-12) was from Santa Cruz Biotechnology. The PARP antibody was from BD Biosciences. All antibodies were used at a 1:1,000 dilution, except for the β-tubulin antibody, which was used at 1:10,000 dilution.
Kinase Inhibitors.
PHA-665752 was kindly provided by Pfizer Inc. Erlotinib was obtained from the MGH pharmacy. The BRAF inhibitor, AZ628, was synthesized by Astra Zeneca. The additional inhibitors were either obtained from the MGH pharmacy or were synthesized at the Dana–Farber Cancer Institute, based on published structures.
Cell Growth/Viability Assays.
Cells were seeded at ≈15% confluency in 96-well microplates (BD Biosciences) in medium supplemented with 5% FBS. After overnight incubation, cells were treated with three concentrations of each compound by using a Caliper Sciclone ALH3000 multichannel liquid-handling workstation (Caliper Life Sciences). After 72 h, cells were fixed in 4% formaldehyde in PBS and stained in a 1:5,000 solution of the fluorescent nucleic acid stain Syto60 (Molecular Probes). Quantitation of fluorescence was carried out at excitation and emission wavelengths of 630 and 695 nM respectively by using the SpectraMax M5 plate reader (Molecular Devices). The mean of triplicate values for each drug concentration was compared with untreated wells, and a ratio was calculated.
DNA Sequencing.
Genomic DNA was isolated from cell lines by using the Gentra purification system according to the manufacturer's protocol. The EGFR kinase domain (Exons 18–24) was amplified from genomic DNA by PCR with primers listed below. PCR products were purified and subjected to bidirectional sequencing by using BigDye v1.1 (Applied Biosystems) in combination with an ABI3100 sequencer (Applied Biosystems). Primers used for sequencing of EGFR exons 18–21 and MET exons 15–21 are listed in SI Fig. 16. For exons 22–24 sequencing primers were identical to PCR primers. BRAF exons 11 and 15 were sequenced by using primers listed in SI Fig. 16. Electropherograms were analyzed by using Sequence Navigator software (Applied Biosystems). All mutations were confirmed by at least two independent PCR amplifications. Some of the recurrent mutations described in cell lines were based on information reported on the Wellcome Trust Sanger Institute's Cancer Cell Line Project website (www.sanger.ac.uk/genetics/CGP/CellLines).
Gene Copy and GeneChip Mapping Assays.
Gene copy numbers were determined as described by using the GeneChip Human Mapping 250K (Affymetrix). The array was then scanned on the GeneChip Scanner 3000 7G and analyzed by using GTYPE version 4.0 with the Dynamic Model Mapping Algorithm and the GeneChip Human Mapping 500K Set library files (Mapping 250K_Nsp or Mapping 250K_Sty) (SI Fig. 17). Copy number data were available for the 374 cell lines listed in SI Fig. 17.
Data Analysis.
The sensitivity of each cell line to a given concentration of compound is calculated as the fraction of viable cells relative to untreated cells. The Cluster software package was used to adjust data before hierarchical clustering. Sensitivity data were centered by subtracting the cell line sensitivity median and the compound sensitivity median from the values in the respective rows and columns, such that the median value of each row and column is 0. The data were then organized by using average linkage hierarchical clustering to facilitate visualization of similarities and differences in cell line sensitivity to various compounds across the entire set of cell lines. Resulting clusters were visualized by using Java Treeview. The Cluster and TreeView software programs are available from the Eisen laboratory (http://rana.lbl.gov/EisenSoftware.htm) (21). Pearson's Goodness of Fit χ2 was used to assign P values at 95% confidence interval to describe the correlations between gene mutations/amplifications and drug sensitivity.
Supplementary Material
Acknowledgments
We thank members of the J.S. and D.A.H. laboratories for helpful discussions and Andrew Su for assistance with the TreeView software. This work was supported by National Institutes of Health Grant R01 CA115830 and an award from the V Foundation (to J.S.). C.M. was supported by Agència de Gestió d'Adjuts Universitaris i de Recerca Grant 2006 BE-2 00121 and Instituto de Salud Carlos III Grant BA07/90064. D.A.H. was supported by the Doris Duke Distinguished Clinical Scientist Award and a grant from the National Foundation for Cancer Research.
Footnotes
The authors declare no conflict of interest.
This article is a PNAS Direct Submission.
This article contains supporting information online at www.pnas.org/cgi/content/full/0707498104/DC1.
References
- 1.Weinstein IB. Science. 2002;297:63–64. doi: 10.1126/science.1073096. [DOI] [PubMed] [Google Scholar]
- 2.Settleman J. Drug Disc Today: Dis Mechan. 2005;2:139–144. [Google Scholar]
- 3.Neve RM, Chin K, Fridlyand J, Yeh J, Baehner FL, Fevr T, Clark L, Bayani N, Coppe JP, et al. Cancer Cell. 2006;10:515–527. doi: 10.1016/j.ccr.2006.10.008. [DOI] [PMC free article] [PubMed] [Google Scholar]
- 4.Sequist LV, Bell DW, Lynch TJ, Haber DA. J Clin Oncol. 2007;25:587–595. doi: 10.1200/JCO.2006.07.3585. [DOI] [PubMed] [Google Scholar]
- 5.Cappuzzo F, Varella-Garcia M, Shigematsu H, Domenichini I, Bartolini S, Ceresoli GL, Rossi E, Ludovini V, Gregorc V, Toschi L, et al. J Clin Oncol. 2005;23:5007–5018. doi: 10.1200/JCO.2005.09.111. [DOI] [PubMed] [Google Scholar]
- 6.Pao W, Wang TY, Riely GJ, Miller VA, Pan Q, Ladanyi M, Zakowski MF, Heelan RT, Kris MG, Varmus HE. PLoS Med. 2005;2:e17. doi: 10.1371/journal.pmed.0020017. [DOI] [PMC free article] [PubMed] [Google Scholar]
- 7.Guo M, Liu S, Lu F. N Engl J Med. 2006;354:2193–2194. doi: 10.1056/NEJMc052698. [DOI] [PubMed] [Google Scholar]
- 8.Hirsch F, Varella-Garcia M, Cappuzzo F, McCoy J, Bemis L, Xavier A, Dziadziuszko R, Gumerlock P, Chansky K, West H, et al. Ann Oncol. 2007;18:752–760. doi: 10.1093/annonc/mdm003. [DOI] [PubMed] [Google Scholar]
- 9.Smolen GA, Sordella R, Muir B, Mohapatra G, Barmettler A, Archibald H, Kim WJ, Okimoto RA, Bell DW, Sgroi DC, et al. Proc Natl Acad Sci USA. 2006;103:2316–2321. doi: 10.1073/pnas.0508776103. [DOI] [PMC free article] [PubMed] [Google Scholar]
- 10.Lutterbach B, Zeng Q, Davis LJ, Hatch H, Hang G, Kohl NE, Gibbs JB, Pan BS. Cancer Res. 2007;67:2081–2088. doi: 10.1158/0008-5472.CAN-06-3495. [DOI] [PubMed] [Google Scholar]
- 11.Davies H, Bignell GR, Cox C, Stephens P, Edkins S, Clegg S, Teague J, Woffendin H, Garnett MJ, Bottomley W, et al. Nature. 2002;417:949–954. doi: 10.1038/nature00766. [DOI] [PubMed] [Google Scholar]
- 12.Garnett MJ, Marais R. Cancer Cell. 2004;6:313–319. doi: 10.1016/j.ccr.2004.09.022. [DOI] [PubMed] [Google Scholar]
- 13.Eisen T, Ahmad T, Flaherty KT, Gore M, Kaye S, Marais R, Gibbens I, Hackett S, James M, Schuchter LM, et al. Br J Cancer. 2006;95:581–586. doi: 10.1038/sj.bjc.6603291. [DOI] [PMC free article] [PubMed] [Google Scholar]
- 14.Solit DB, Garraway LA, Pratilas CA, Sawai A, Getz G, Basso A, Ye Q, Lobo JM, She Y, Osman I, et al. Nature. 2006;439:358–362. doi: 10.1038/nature04304. [DOI] [PMC free article] [PubMed] [Google Scholar]
- 15.Tabernero J, Cervantes A, Hoekman K, Hurwitz HI, Jodrell DI, Hamberg P, Stuart M, Green TP, Iacona RB, Baselga J. ASCO Ann Meet Proc Part I. 2007;25:3520. [Google Scholar]
- 16.Blackhall F, Ranson M, Thatcher N. Lancet Oncol. 2006;7:499–507. doi: 10.1016/S1470-2045(06)70725-2. [DOI] [PubMed] [Google Scholar]
- 17.Engelman JA, Zejnullahu K, Mitsudomi T, Song Y, Hyland C, Park JO, Lindeman N, Gale CM, Zhao X, Christensen J, et al. Science. 2007;316:1039–1043. doi: 10.1126/science.1141478. [DOI] [PubMed] [Google Scholar]
- 18.Houldsworth J, Cordon-Cardo C, Ladanyi M, Kelsen DP, Chaganti RS. Cancer Res. 1990;50:6417–6422. [PubMed] [Google Scholar]
- 19.Cohen EE, Lingen MW, Martin LE, Harris PL, Brannigan BW, Haserlat SM, Okimoto RA, Sgroi DC, Dahiya S, Muir B, et al. Clin Cancer Res. 2005;11:8105–8108. doi: 10.1158/1078-0432.CCR-05-0926. [DOI] [PubMed] [Google Scholar]
- 20.Schilder RJ, Sill MW, Chen X, Darcy KM, Decesare SL, Lewandowski G, Lee RB, Arciero CA, Wu H, Godwin AK. Clin Cancer Res. 2005;11:5539–5548. doi: 10.1158/1078-0432.CCR-05-0462. [DOI] [PubMed] [Google Scholar]
- 21.Eisen MB, Spellman PT, Brown PO, Botstein D. Proc Natl Acad Sci USA. 1998;95:14863–14868. doi: 10.1073/pnas.95.25.14863. [DOI] [PMC free article] [PubMed] [Google Scholar]
Associated Data
This section collects any data citations, data availability statements, or supplementary materials included in this article.


