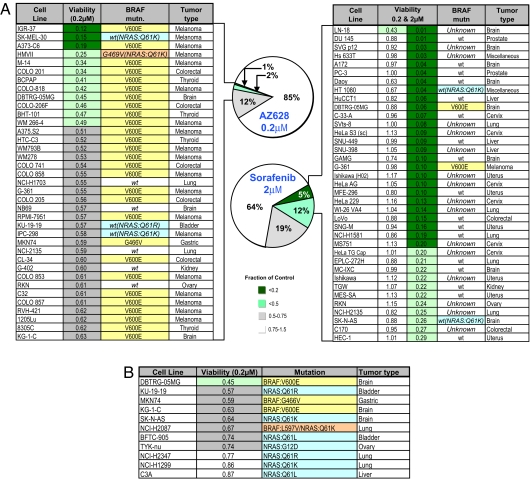
Fig. 4.
Sensitivity to a selective BRAF kinase inhibitor is well correlated with BRAF mutational status in tumor cell lines, irrespective of tissue of origin. (A) Pie chart representation of the sensitivity of 500 human tumor cell lines to treatment with 200 nM BRAF inhibitor AZ628 and 2 μM sorafenib for 72 h. The drug effect was calculated as the fraction relative to untreated controls, and values for the top 7% of responders were tabulated, as shown in the chart. The mutational status of BRAF, where known, is indicated. The tumor type is also indicated. For comparison, the sorafenib table also shows the sensitivity of cell lines to 200 and 2 μM sorafenib. The only sorafenib-sensitive cell lines with a V600E mutation in BRAF (melanoma G-361) were also sensitive to AZ628. However, the sensitivity of G-361 placed it at position 57, which falls outside of the top 34 AZ628-sensitive cell lines shown in the table. (B) Sensitivity to AZ628 of nonmelanoma cell lines harboring BRAF or NRAS mutations.

