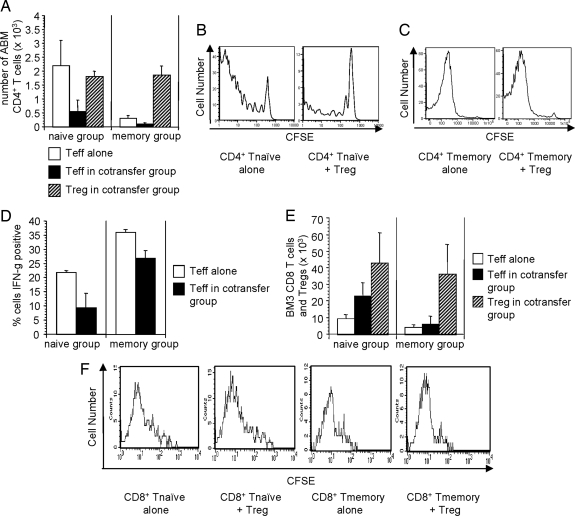
Fig. 4.
Resistance of memory T cells to in vivo regulation. (A–D) B6 RAG-1−/− mice received bm12 skin grafts and 5 days later were adoptively transferred with CFSE-labeled Thy1.1+ naive or memory ABM T cells plus Thy1.2+ ABM Tregs. Animals were killed on days 10 and 11 for analysis. (A) Total number of live, alloantigen-reactive CD4+ naive T cells, memory T cells, and Tregs (Thy1.1−CD3+) in draining lymph nodes of skin graft recipients. (Left) Animals receiving naive T cells plus Tregs. (Right) Animals receiving memory T cells plus Tregs. Open bars are effector T cells (naive or memory Thy1.1+ cells) from animals that did not receive cotransfer of Tregs. Filled bars are effector T cells from animals that also received cotransfer of Tregs. Hatched bars are Tregs in animals that received cotransfer of Tregs. (B and C) CFSE histograms of transferred naive and memory T cells. (D) Transferred naive and memory ABM T cells were restimulated in vitro with PMA plus ionomycin for 5 h and then stained for intracellular IFN-γ. (E and F) Naive or memory BM3 T cells were transferred to CBA RAG-1−/− mice with or without tolerized Tregs. All mice received a B10 skin graft 1 day after cell transfer. (E) Total number of live, BM3 CD8+ naive and memory T cells and polyclonal Tregs (CD4+) in draining lymph nodes 10 days after B10 skin transplantation. (F) CFSE histograms of live naive and memory CD8+ BM3 T cells in the draining lymph nodes of mice 10 days after B10 skin transplantation. These data show the mean number of BM3 T cells with one standard deviation (n = 2–3 mice per group). The data are representative of one to three independent experiments.

