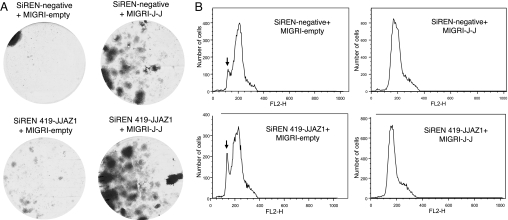
Fig. 7.
Cell survival after culture under hypoxic conditions simulated by addition of desferrioxamine, as described under Materials and Methods. (A) Images of representative tissue culture dishes showing numbers of colonies after staining with crystal violet. Dishes were initially seeded with 2 × 10³ cells. Surviving colonies containing the JAZF1–JJAZ1 fusion tended to be confluent by the time any colonies in the control dishes appeared, thereby precluding accurate quantitative assessment of the survival advantage to cells with the JAZF1–JJAZ1 fusion, as in Fig. 6C. (B) FACS analysis of DNA content in cells stained with propidium iodide. The vertical arrows indicate the peak of sub2n cells, reflecting ongoing apoptosis in these cells. The horizontal axis represents the number of cells.

