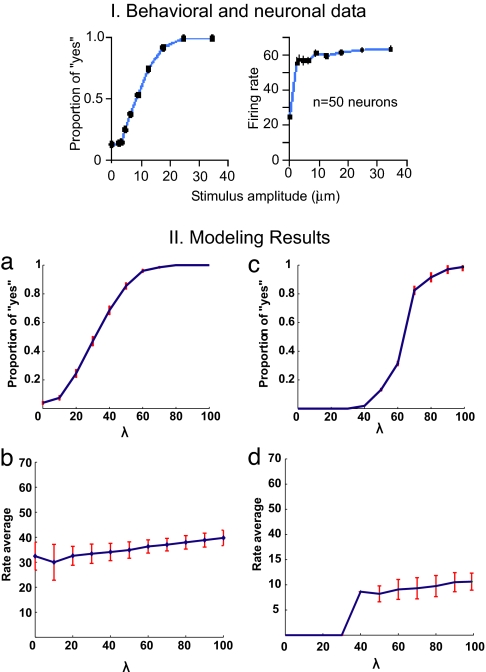
Fig. 1.
Experimental and simulated neural and behavioral data. I. Behavioral and neuronal data. Behavioral detection curve and responses to the stimulus of MPC neurons. (Left) Proportion of “yes” responses as a function of the amplitude of a 20-Hz vibratory stimulus applied to a fingertip (500 trials for each noncero amplitude and 4,500 trials for the cero amplitude). (Right) Mean response of MPC neurons as a function of stimulus amplitude. In contrast to what has been observed in primary somatosensory areas, stimulus amplitude has little effect on the activity of MPC neurons. II. Modeling results. NCYN model (a and b) and CYNN model (c and d).

