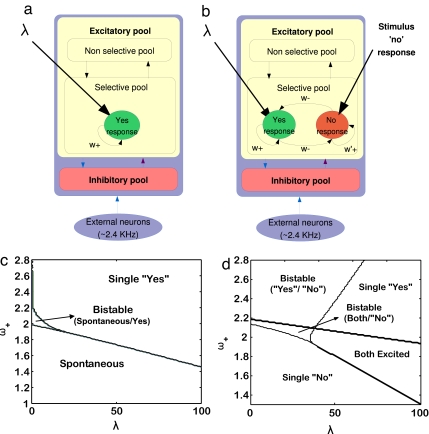
Fig. 4.
Network architecture and corresponding bifurcation diagrams. (Upper) Minimal network architecture of the MPC model. The two proposed models are shown in a and b. (a) The model NCYN has excitatory populations selective to the applied vibrotactile stimulation. A “no” response is given when the selective population is low activated and a “yes” response is given when it is high activated. (b) The CYNN model has excitatory selective populations encoding the “yes” response selective to the stimulus applied and a selective population encoding a “no” response by default. The “no” by default is modeled as a constant bias to the population that codifies the “no” response. A “yes” response is given when the population sensitive to the frequency applied is high activated over the population that codifies the “no” response. A “no” response is given when the population sensitive to the stimulus is inhibited by the population that codifies the “no” response. The arrows indicate the recurrent connections between the different neurons in a pool. (Lower) Bifurcation diagrams for both NYCN (c) and CYNN (d) models. The diagrams show the different attractor regions as a function of the stimulus input (λ) and the level of coupling within the neurons of the same selective population (cohesion).

