
Fig. 1.
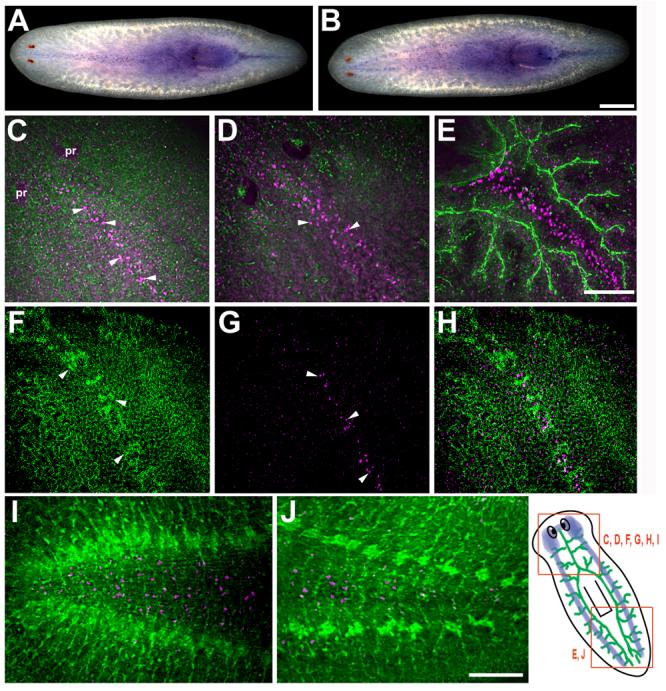
Expression pattern of Smed-slit mRNA in intact planarians. (A-B) Whole-mount in situ hybridization showing distinct populations of Smed-slit-positive cells at the midline observed from either dorsal (A) or ventral (B) views. (C-J) Double labeling to detect Smed-slit mRNA (in magenta) by whole-mount fluorescent in situ hybridization and immunostaining with either anti-phospho-tyrosine (green in C-E; I-J) or anti-Tubulin (green in F,H). (C) Smed-slit-positive cells (arrowheads) along the midline in the submuscular plexus (in green). (D) Smed-slit-positive cells (arrowheads) deeper in the mesenchyme. (C) and (D) are confocal projections from different focal planes of the same sample. (E) Smed-slit positive cells between the two posterior gut branches (in green). (F) Midline dorsal stripe of ciliated epithelial cells labeled with anti-Tubulin (arrowheads). (G) Smed-slit-positive cells (arrowheads) in the submuscular plexus, beneath the epithelium. (F) and (G) are confocal projections from different focal planes of the same sample. (H) is a merged image of (F) and (G). (I-J) Ventral views of Smed-slit mRNA expression between the cephalic ganglia (in green) in the head (I) and between the ventral nerve cords (in green) in the post-pharyngeal region (J). The drawing at the lower right shows the regions of the animal represented in the indicated panels. The CNS is depicted in blue and the digestive system is shown in green; the digestive system is located dorsally with respect to the CNS. Note that (C-H) are oriented anterior to the top left corner, whereas, (I, J) are oriented anterior to the left. (C-H) dorsal views, (I, J) ventral views. Abbreviation: pr, photoreceptors. Scale bars: 500 μm in A, B; 100 μm in C-H; 100 μm in I,J.