
Fig. 7.
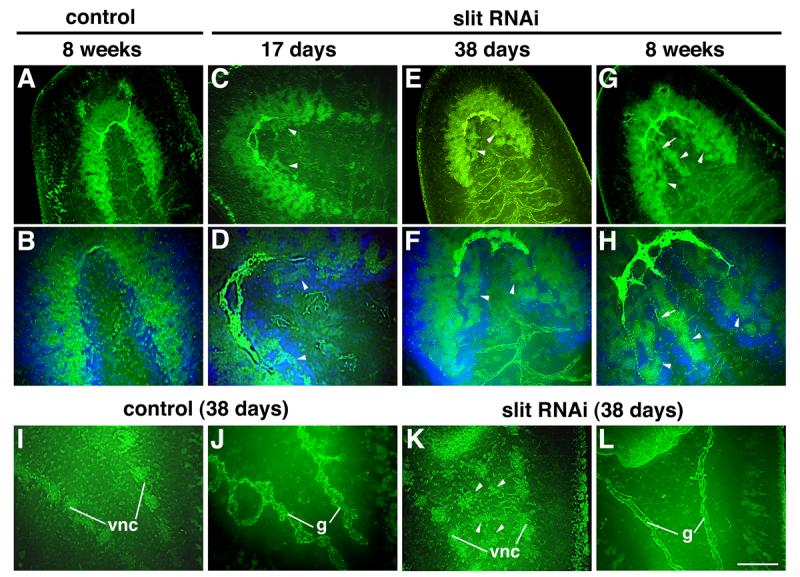
Development of ectopic neural tissues in intact animals after Smed-slit RNAi. (A-H) Confocal projections of intact heads visualized using anti-phospho-tyrosine (green) and VC-1 immunofluorescence (bright green). (A, B) Control planarian 8 weeks after control injections. (C-H) Smed-slit RNAi animals fixed at the indicated times after initiating dsRNA injections. (B), (D), (F) and (H) are counterstained with Hoechst (in blue) and correspond to higher magnification views of (A), (C), (E) and (G), respectively. Arrowheads point to ectopic neural tissues; arrows in (G,H) label photoreceptor projections to the ectopic ganglia. (I-L) Confocal projections of the post-pharyngeal regions of intact planarians visualized by anti-phosphotyrosine immunofluorescence. (I-J) Control and (K-L) Smed-slit RNAi knockdown planarians fixed 38 days after the first injection. (I) and (K) show planes at the level of the ventral nerve cords; (J) and (L) show planes dorsal to those shown in (I) and (K), respectively, at the level of the gut branches. Ectopic neural tissue is indicated by the arrowheads in (K). Anterior to the upper left. Abbreviations: g, gut; vnc, ventral nerve cords. Scale bar (shown in L): 100 μm in A, C, E, G, I-L; 50 μm in B, D, F, H.