
Figure 4.
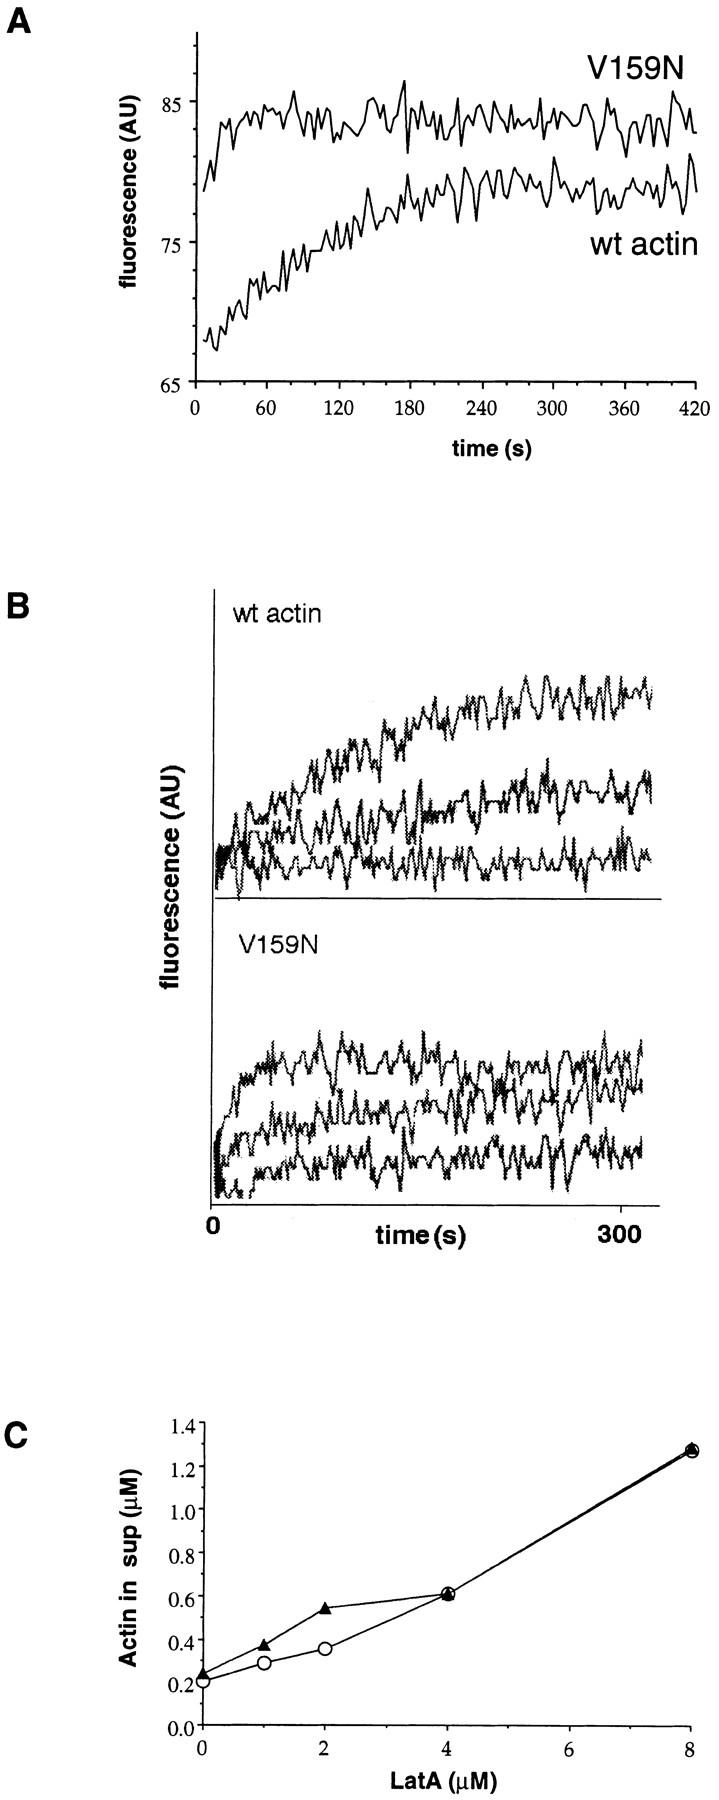
LAT-A binding and ATP exchange. (A) ATP exchange was measured by monitoring the increase in fluorescence of ε-ATP upon binding to monomeric actin. Each measurement was repeated three times, and the t 1/2 of V159N actin was 15 s (15 s, 15 s, 14 s), and the t 1/2 of wild-type actin was ∼100 s (100 s, 102 s, 100 s). Typical plots of fluorescence are shown. The beginning and ending fluorescence levels for wild-type actin are 68 and 80. The beginning and ending fluorescence levels for the V159N actin are 80 and 85. There is a dead time of ∼4 s before the first measurement can be recorded, so it is possible that the starting point for the V159N actin is similar to that of the wild-type actin. This would make the value of 15 s an overestimate of the t 1/2 of ATP exchange, because most of the exchange would have occurred in the dead time. (B) LAT-A was added to the ATP exchange reactions to a final concentration of 0, 2.5, and 5 μM. The t 1/2 of ATP exchange in 2.5 μM LAT-A is approximately doubled for both V159N and wild-type actin, suggesting similar affinities for LAT-A. (C) Increasing concentrations of LAT-A were added to 4 μM polymerized actin. After 1 h, the polymerized actin was pelleted and the amount of actin left in the supernatant was quantified (○, wild-type actin; ▴, V159N actin).