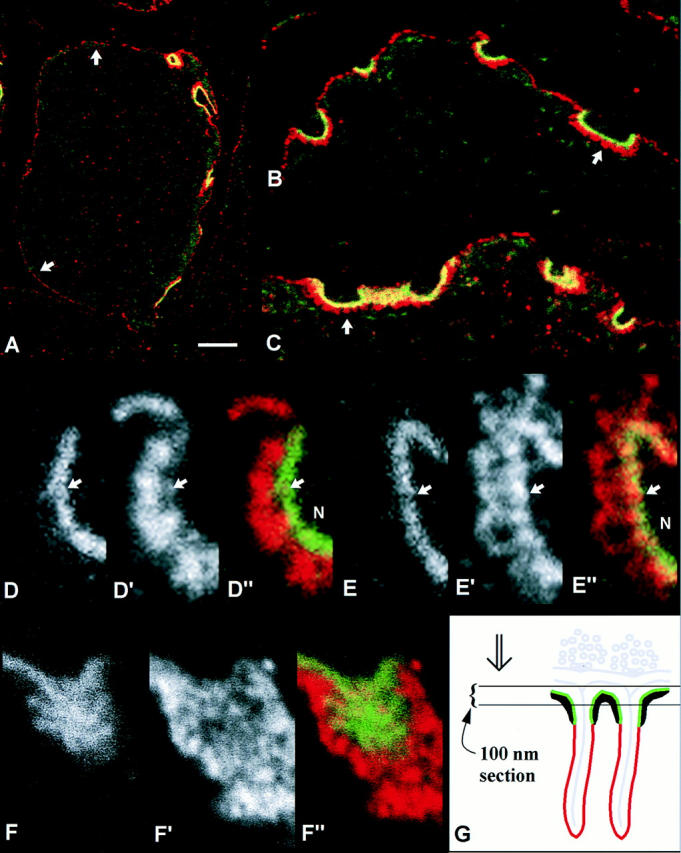
Figure 6.

High resolution localization of α-dystrobrevin-1 and α-dystrobrevin-2 at the NMJ. Cryostat sections of mouse sternomastoid muscle were double-labeled on AChRs (with α-bungarotoxin; green) and on α-dystrobrevins (antibodies; red), then prepared for confocal microscopy. Yellow, overlap of strong red and green signals. (A) Muscle fiber labeled with Ab αDb638, against α-dystrobrevin-1. The four nerve– muscle contacts on the fiber are strongly labeled (right-hand side of the fiber). The extrajunctional sarcolemma is weakly labeled (arrows). (B and C) Higher magnification views of junctions labeled with Ab αDb2 against α-dystrobrevin-2 (B) and Ab αDb638 (C). The folds are strongly labeled (arrows). Extensive overlap of the red and green labels on the crests is suggested by the yellow. (D–D″ and E–E″) Partial views of single nerve–muscle contacts labeled with Ab αDb2 (D–D″) and Ab αDb638 (E–E″). N, nerve terminal. (D and E) The separated green channels showing receptor labeling. (D′ and E′) Red channels showing antibody labeling. (D″ and E″) the combined red and green channels. Arrows pointing to the extracellular side of the α-BgTx images in D″ and E″ are reproduced at equivalent positions in D and D′, and in E and E′, respectively. Ab αDb638 (α-dystrobrevin-1) gave stronger labeling of the crests than the deep portions (E′), while Ab αDb2 (α-dystrobrevin-2) labeled the deep portions more strongly (D′). (F–F″) En face view of a receptor-rich area in a cell labeled with Ab αDb2. Extensive overlap of α-BgTx and antibody labeling is apparent. The deep portions of the folds, surrounding the toxin-labeled area, are more strongly labeled by the antibody than the crest area. (G) A schematic representation of the sectioning that gives rise to en face views involving two adjacent folds. Green, receptor-rich membrane. Red, antigen-rich membrane in the deep folds. Black, submembrane cytoskeletal specialization the antigen content of which is to be evaluated. The parallel lines indicate, to scale, a plane of section that projects from the page; in the region shown, the section includes receptor-rich regions, but no membrane from the deep folds. Double arrow, direction of viewing, parallel to the page. Gray, synaptic basal lamina, presynaptic membrane, synaptic vesicles. Bars: (A) 8 μm; (B) 3.3 μm; (C) 2.8 μm; (D) 0.7 μm; (E), 0.6 μm; (F) 1.0 μm.
