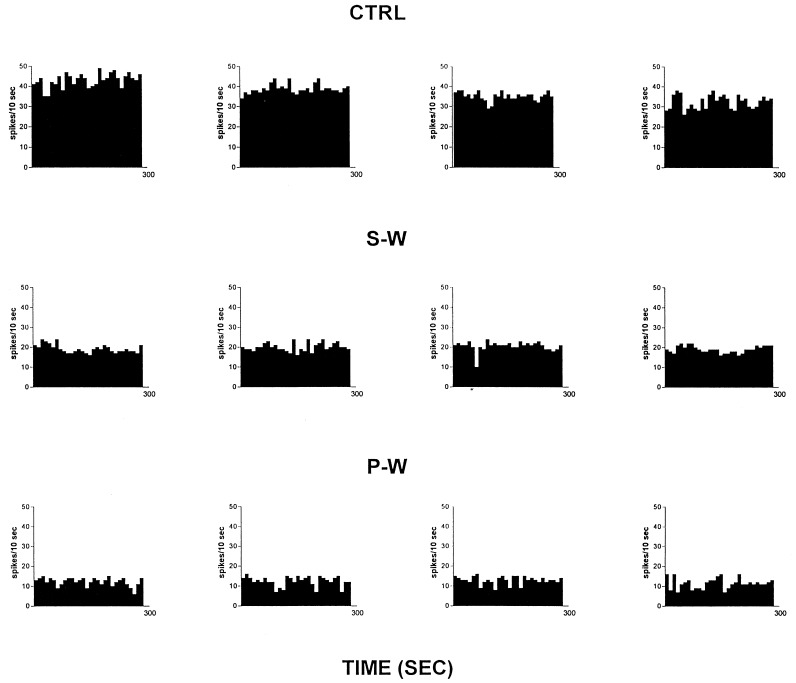
Figure 2.
Spontaneous activity of antidromically identified VTA-accumbens DA neurons encountered in a rat belonging to the CTRL (Top) S-W (Middle) and P-W (Bottom) groups, respectively. Each histogram represents the neuronal activity of a single neuron. Note the difference in spontaneous activity in the three groups. Recordings were obtained 24 h after last Δ9-THC (S-W) and vehicle administration (CTRL) and 2–3 h after SR 141716A administration (P-W).

