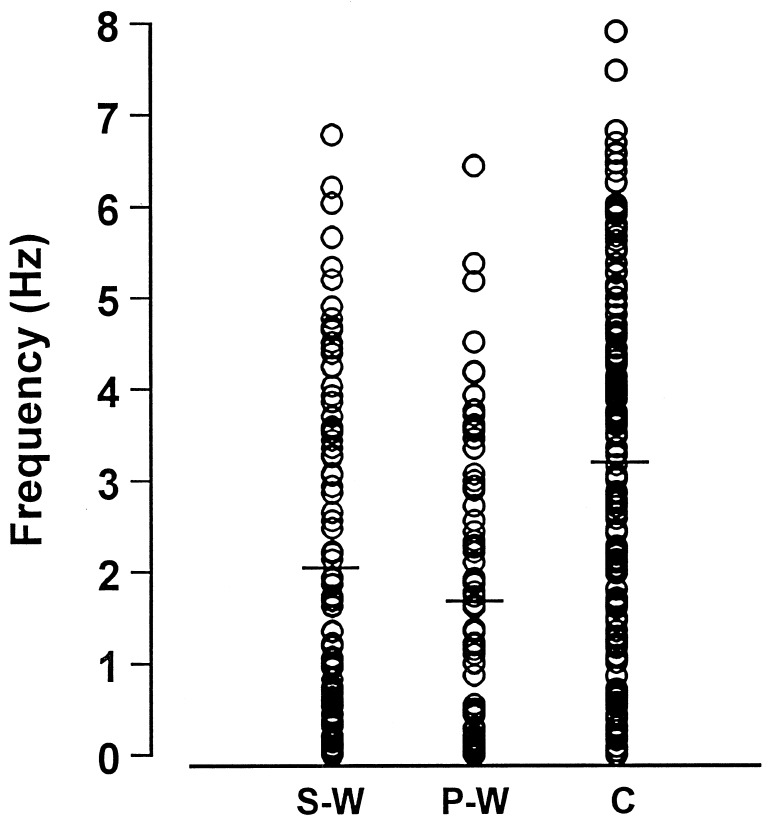
Figure 3.
Individual firing rates of antidromically identified VTA-accumbens DA neurons recorded from S-W, P-W and Control groups. Each circle represents the mean firing rate of 5-min recording. Note the difference in distribution and the trend in silencing from Control toward cannabinoid withdrawal conditions. Horizontal bars indicate the mean activity as reported in Table 1.

