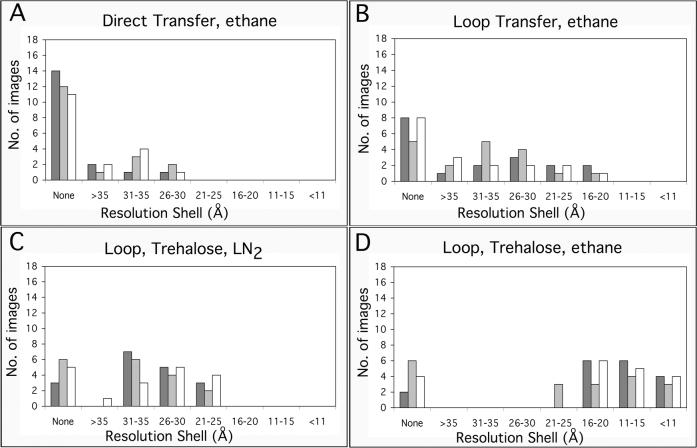
Figure 5. Resolution of images taken from crystals prepared on continuous carbon grids by the indicated methods.
For each preparation method, 3 grids were prepared and 18 images of sbpA crystals were taken from each grid (indicated by different grey shades). The resolution of the imaged crystals was assessed by the highest diffraction spots seen by optical diffraction. The graphs show the number of images taken from each grid that showed diffraction spots in the indicated resolution ranges.

