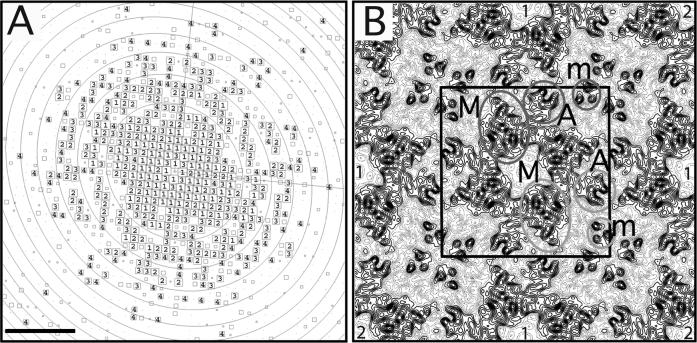
Figure 6. Electron crystallographic analysis of trehalose-embedded sbpA lipid monolayer crystals.
(A) CTF plot of a representative image of a trehalose-embedded 2D crystal. The circles represent CTF zero transitions and the boxed numbers depict the IQ values of the individual reflections as defined by Henderson et al. (1986). Scale bar is (1.5 nm)−1. (B) p4-symmetrized projection map of sbpA at 7 Å resolution. A unit cell with a side length of a = b = 133 Å is outlined in black. The major (M), arm (A) and minor (m) domains of two sbpA subunits are labeled. The light grey circles show the arrangement of the domains if the monomer adopted a compact organization in the 2D arrays and the dark grey circles the arrangement of the domains if the monomer adopted an extended organization. Nearest and second-nearest neighboring sbpA tetramers with respect to the central tetramer are labeled by “1” and “2”, respectively.

