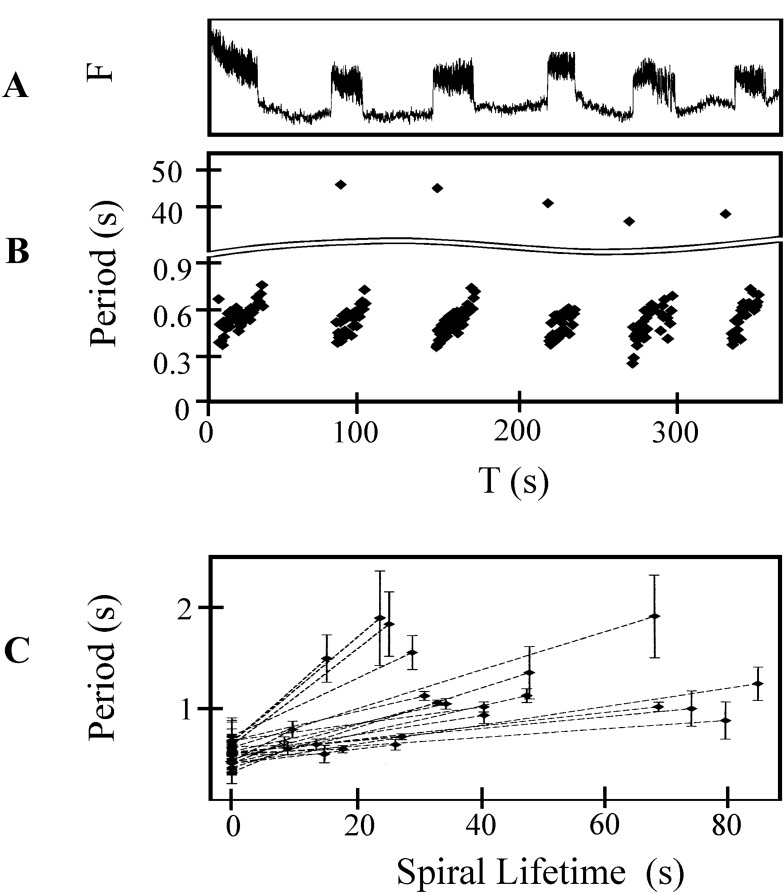
Figure 1.
Dynamics of burst generation. (A) Calcium fluorescence for six consecutive bursts from a 1 mm2 area. (B) The interbeat period measured from calcium fluorescence during rotor bursting as a function of time. During each burst duration increases from about 0.4 s to 0.8 s. The interburst duration ranges from 36 s to 44 s. (C) Average period of rotor rotation for 24 representative rotor bursts taken from 6 different preparations. The average period, calculated for the first and last five rotations of each rotor during a burst, is plotted as a function of burst duration. The error bars show the standard deviation of the period over the five averaged periods.

