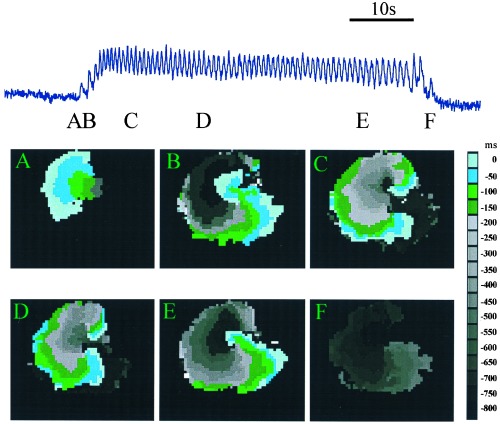
Figure 2.
Anatomy of a typical burst. The upper trace shows fluorescence intensity during a single burst. The width of each panel is 1 cm. The colored images show contour plots of activation times at several different times during the burst indicated by the labels. Contour maps are constructed by determining the location of the activation front at 50-ms intervals. The location of the activation front at a given time is plotted in a color given by the key. This format allows for the representation of a number of consecutive raw data frames onto a single composite image. Activation front detection is determined by a threshold set at half maximum fluoresence. (A) Unidirectional block. The wave is initiated at a single site and propagates only to the left. (B) Formation of two mirror-image rotor waves. The excitation doubles back, to invade the tissue forming a mirror-image pair or rotors. (C and D) Contour plots of the mirror-image pair of rotors. (E) Destruction of one of the rotors leaves a single rotor (F) Termination of the remaining rotor.

