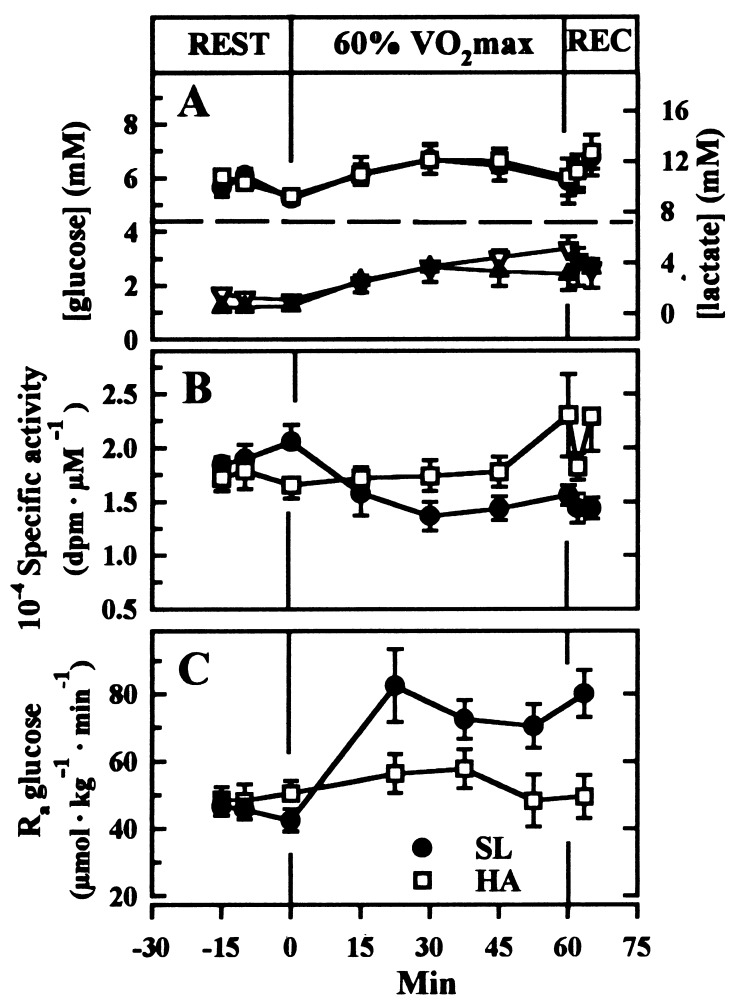
Figure 3.
Plasma concentration (A), specific activity (B), and rate of appearance (Ra) (C) of glucose before, during, and after 60 min of exercise at 60% V̇O2max. A also contains plasma lactate concentrations (▿ and ▴, HA and SL, respectively) at rest, during exercise, and in recovery (REC) (n = 8).

