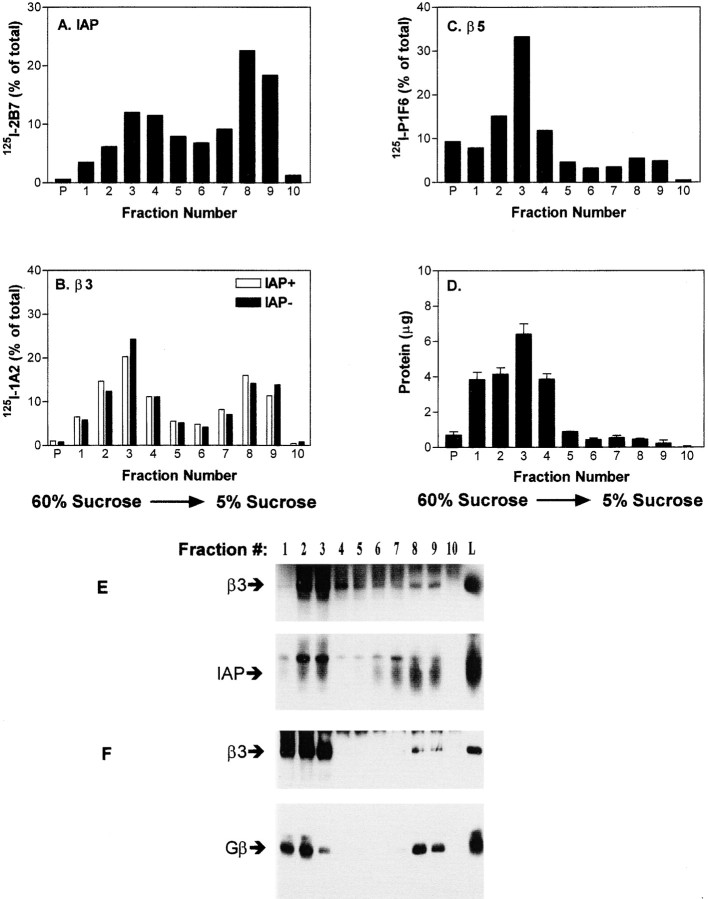
Figure 4.
DIGs localization of components of the signaling complex. Specific radioactivity in sucrose density fractions obtained from OV10 cells labeled with 125I mAbs specific for IAP (mAb 2B7; A), αvβ3 (mAb 1A2; B), or αvβ5 (mAb P1F6; C) are shown. Data is presented as a percentage of the total input counts in each fraction. In B, distribution of radioactivity in cells with and without IAP are compared. D, Distribution of total protein, measured by the BCA assay. The sucrose concentration is highest in fraction 1 and least in fraction 10. P denotes radioactivity or protein in the pellet. DIGs migrate to the interface of the 25 and 5% sucrose solutions (fraction 7–9), while the vast majority of membrane protein is contained within the 40% sucrose fractions. Data is representative of three or more experiments. E and F, αvβ3 was immunoprecipitated with mAb 1A2 from each fraction of a sucrose density gradient prepared with unlabeled OV10 cells expressing wild-type IAP. The samples were analyzed by SDS-PAGE and Western blotting using anti-β3 mAb 7G2 and anti-IAP mAb B6H12 (E) or anti-β3 and rabbit antibodies specific for Gβ (F).

