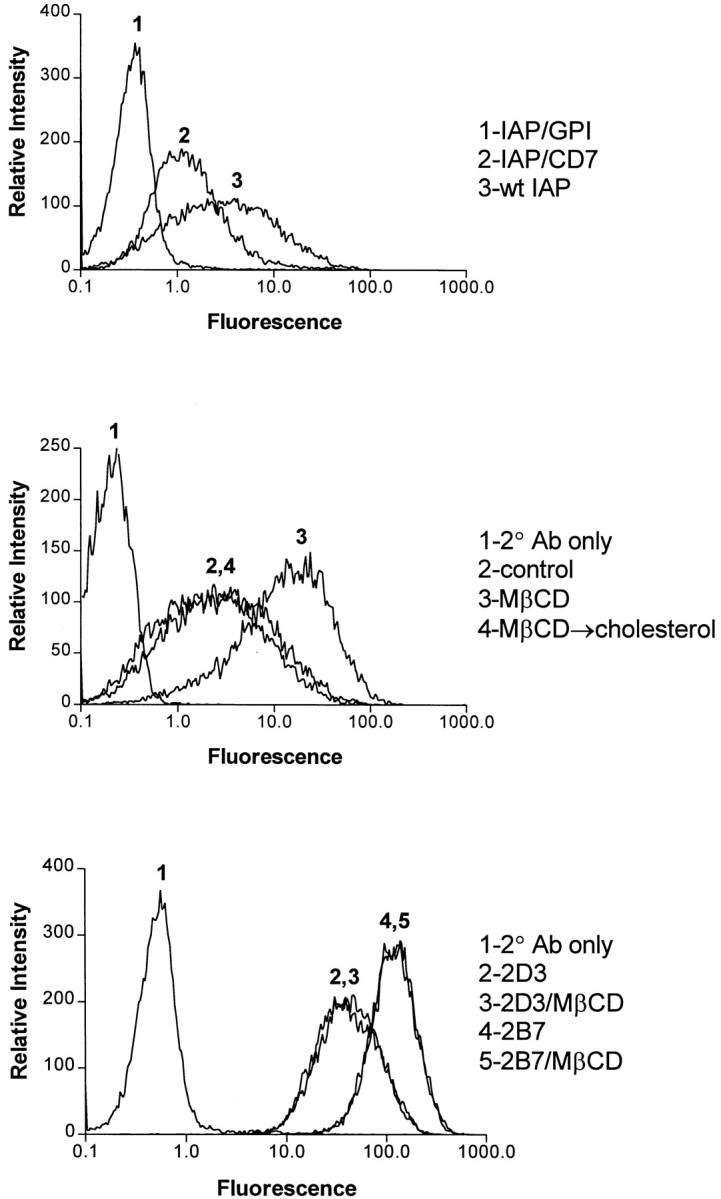
Figure 6.

Binding of mAb 10G2 to IAP. Top, OV10 cells expressing IAP, IAP/GPI, or IAP/CD7 were incubated with the mAb 10G2. FACS® analysis with anti-IAP mAb B6H12 showed that both IAP/GPI and IAP/CD7 were expressed at a level at least equivalent to that of wild-type IAP (mean channel fluorescence wild-type IAP, 3.8 ± 0.1; IAP/GPI, 6.1 ± 0.3; IAP/CD7, 11.7 ± 1.4; Lindberg et al. 1996b; data not shown). Middle, 10G2 binding was determined on buffer-treated OV10, cholesterol-depleted OV10, and cholesterol-repleted OV10 expressing wild-type IAP. Bottom, Binding of conventional anti-IAP mAb 2D3 and 2B7 (Brown et al. 1990) was determined on buffer-treated and MβCD-treated OV10 expressing wild-type IAP.
