
Figure 3.
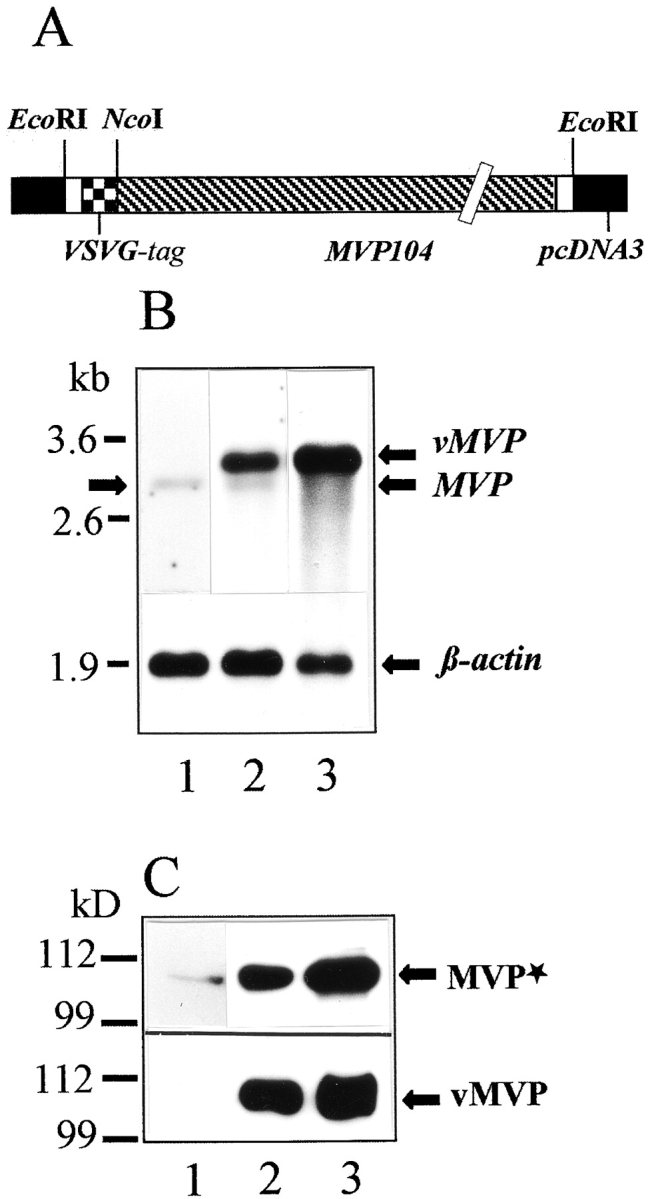
Transient expression of rat vMVP in CHO cells. (A) Schematic drawing of the engineered construct denoted pvMVP for heterologous expression of rat MVP in mammalian cell lines is shown. Note that expression vector and cDNA sequence encoding MVP are not in scale. (B) Northern blot using a DIG-labeled RNA encoding rat MVP as a probe is shown. 800 ng of mRNA was applied per lane. Lane 1 shows mRNA isolated from nontransfected CHO cells; lane 2 shows mRNA from CHO cells transfected with pvMVP; and lane 3 shows mRNA from transfected CHO cells treated with sodium butyrate. The hybridization signal for β-actin (lower graph) served as a control. Arrows indicate the position of the endogenous MVP transcript (left and right), overexpressed vMVP, and β-actin (both right). The position of marker RNA is given in kilobases. (C) Western blot using total protein extract of CHO cells, polyclonal affinity-purified anti–rat vault antibody (upper graph), or anti-VSVG mAb (lower graph) is shown. (Lane 1) Nontransfected; (lane 2) pvMVP-transfected, and (lane 3) pvMVP-transfected and butyrate-treated cells. 30 μg of protein was applied per lane. Protein bands detected by anti-MVP antibody (MVP*) or anti-VSVG antibody (vMVP) are marked by arrows (right). Note, the anti-MVP antibody detects endogenous and recombinant MVP. The size of marker polypeptides is given in kilodaltons (left).