
Figure 3.
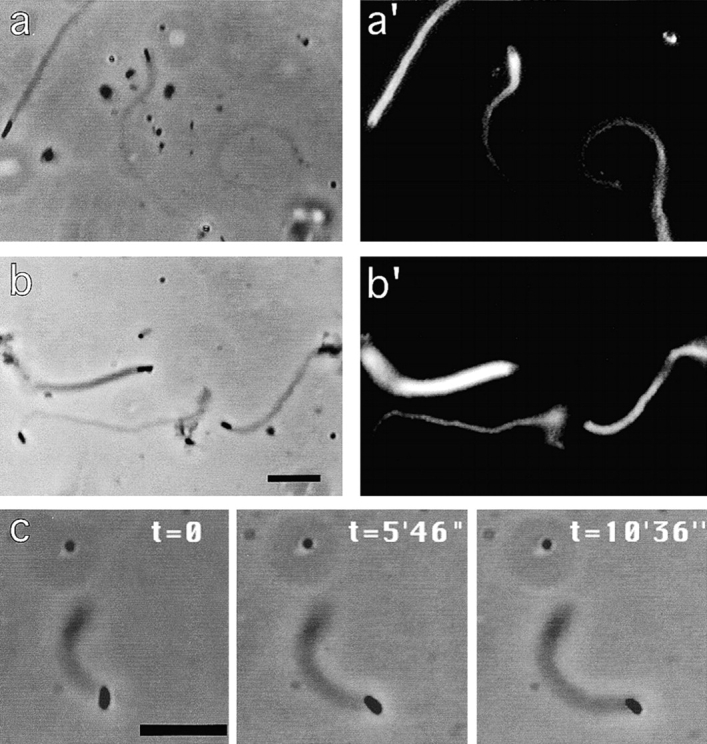
Movement of L. monocytogenes in mouse brain extracts from wild-type and Mena (−/−) animals. Typical actin tails formed in wild-type (a and a′) and in Mena (−/−) (b and b′) mouse brain extracts. (a and b) Phase-contrast; (a′ and b′) rhodamine-actin fluorescence. c shows a time-lapse illustration of the movement. Bar, 5 μm.