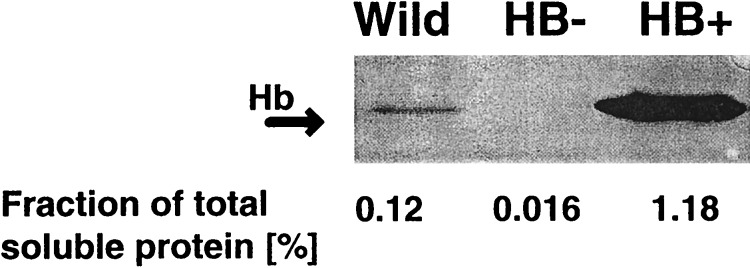
Figure 2.

Protein immunoblot analysis of hemoglobin expression in wild-type (BMS), HB+, and HB− maize cells with recombinant barley hemoglobin-specific antibody (17). Protein (100 μg) in crude cell extract was loaded into each lane. Arrow indicates an 18.5-kDa hemoglobin band. Numbers below the lanes represent concentration of hemoglobin as a fraction of total soluble protein.
